
Channel patterns seem to be popular lately. While everyone is waiting for EUR/NZD to breakout from its
The chart below shows the pattern marked with yellow lines. The entry levels are located at the distance of 10% of channel’s height and are marked with the cyan lines. Green lines form the moving targets with a profit level of 100% of the channel’s height. Breakout
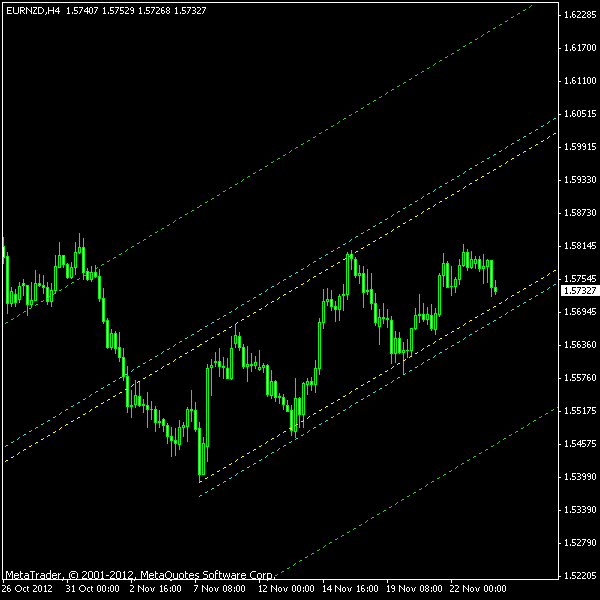
You can also download my MetaTrader 4 chart template for this EUR/NZD pattern.
Do not forget to revisit this post for my trading updates on this pattern.
Update 2012-11-27 14:59 GMT: Bearish position triggered about 4 hours ago at 1.5725 with SL at 1.5802 and TP at 1.5507. Unfortunately, the price barely touched the entry point and then pulled back significantly. I am afraid my 10% entry buffer failed me. This trough can be just a new lower point of a reforming channel.
Update 2012-11-29 15:48 GMT: Alas, my
If you have any questions or comments regarding this EUR/NZD channel pattern, please feel free to reply via the form below.