- December 21, 2020 Do we get tax benefits on Personal Loan?
- December 18, 2020 The solicitors Preston depends on for stress-free compensation claims
- December 16, 2020 eToro: History and Key Features
- December 11, 2020 Canadian Dollar Pauses 2020 Rally Against US Peer Amid Falling Crude Prices
- December 11, 2020 Pound Crashes Against Dollar As No-Deal Brexit Appears Imminent
- December 11, 2020 USD/JPY 104.57 High Starting a New Bearish Leg?
Day: February 17, 2013
 February 17
2013
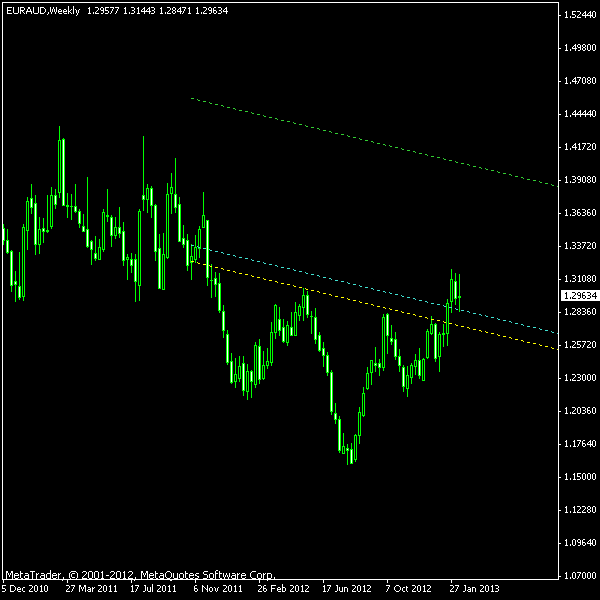
Inverted Head-and-Shoulders on Weekly EUR/AUD Chart
An inverted head-and-shoulders chart pattern can be seen on the weekly chart of EUR/AUD currency pair. It is sloped down and the right shoulder is visibly smaller than the left one, but its long-termbuilt-up (lasting since December 2011) hints at a high probability of success in case of a bullish breakout. Unfortunately, the pattern has already broken out through the neckline. Somehow I failed to notice it for at least 8 weeks. Nevertheless, I will […]
Read more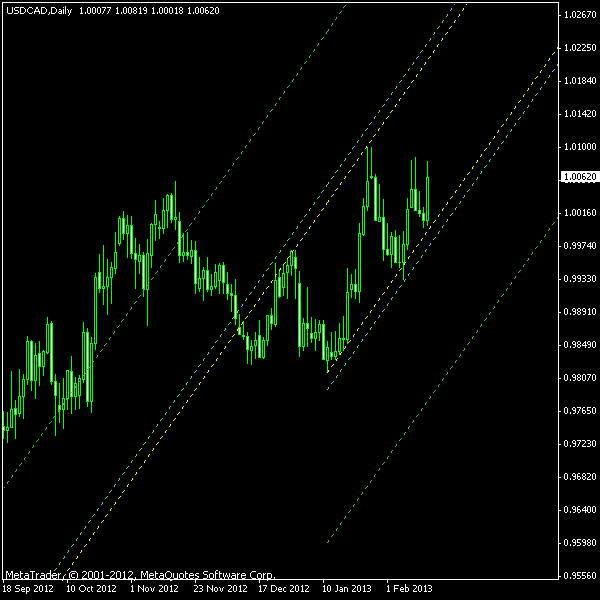 February 17
2013
Ascending Channel on Daily USD/CAD Chart
On its daily chart, the USD/CAD Forex pair is trading inside a rough ascending channel since December 11, 2012. The upper side of the channel is not fully defined (only two price spikes touching it), while the lower border has been broken on February 7. Although there is no significant downtrend prior to this channel, a bearish breakout should be expected as the pattern usually signals a continuation […]
Read more