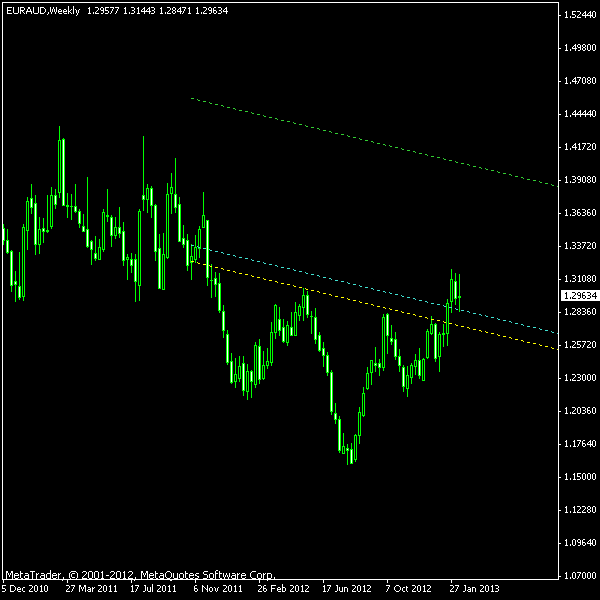
An inverted head-and-shoulders chart pattern can be seen on the weekly chart of EUR/AUD currency pair. It is sloped down and the right shoulder is visibly smaller than the left one, but its long-termbuilt-up (lasting since December 2011) hints at a high probability of success in case of a bullish breakout. Unfortunately, the pattern has already broken out through the neckline. Somehow I failed to notice it for at least 8 weeks. Nevertheless, I will set up a pending buy limit order at the entry line for an opportunity to go long on a pull-back.
The chart below shows the neckline as a yellow dashed line. The cyan entry line is positioned above the neckline at 10% of the pattern’s height. Target line (green) is placed at 100% pattern’s height above the neckline. Should the price return to the entry line, a long position can be opened with a stop-loss at 1.2559 — the low of the week of Jan 14 — Jan 18 — it offers a better level than the low of the breakout week (the next one) as it traded mostly above the neckline.
You can also download my MetaTrader 4 chart template for this EUR/AUD pattern. Update 2013-02-21 12:06 GMT: My pending buy limit order was hit at 1.2849. Stop-loss was set to 1.2559 with take-profit at 1.4039 — a rather nice 4.1 reward/risk ratio. Of course, the take-profit level will be going down each week according to a slope. The pull-back is currently rather strong, so I would not give much confidence to this set-up. Update 2013-03-13 17:36 GMT: Stopped out at 1.2559 about 5 hours ago. It is my third loss this year already. Oh well…
If you have any questions or comments regarding this inverted head-and-shoulders on EUR/AUD chart, please feel free to post them via the form below.