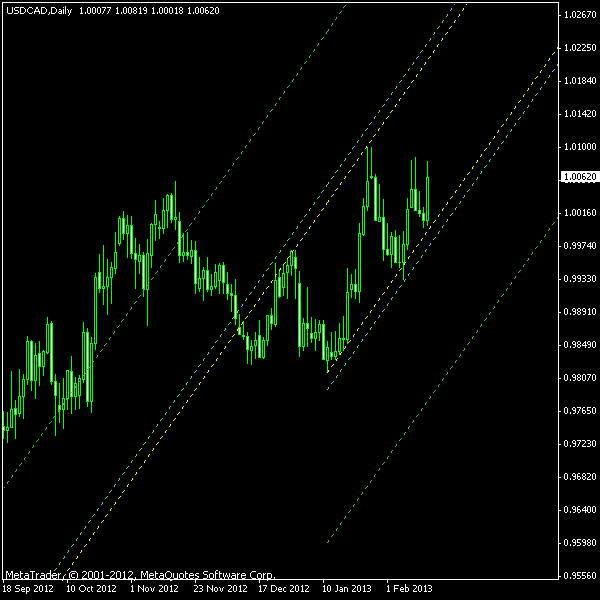
On its daily chart, the USD/CAD Forex pair is trading inside a rough ascending channel since December 11, 2012. The upper side of the channel is not fully defined (only two price spikes touching it), while the lower border has been broken on February 7. Although there is no significant downtrend prior to this channel, a bearish breakout should be expected as the pattern usually signals a continuation of the previous trend.
The borders are showing with the yellow dashed lines. They are encased in the cyan lines, which are marking entry levels for the pending stop orders and are positioned at 10% of channel’s height above and below the borders.

You can download my MetaTrader 4 chart template for this USD/CAD pattern.
By the way, this channel will also be the first pattern that I will trade using the expert advisor in my live account. It is an experimental EA that was created to trade such
Update 2013-02-26 15:32 GMT: The rally broke through the upper border of the channel and triggered the long position entry at 1.0285 exactly 15 minutes ago.
Update 2013-02-28 7:50 GMT: Hit
If you have any questions or comments regarding this ascending channel on USD/CAD chart, please feel free to post them via the form below.