
An interesting trading opportunity is presented by the EUR/JPY chart. A
The chart below shows the descending channel delimited using the yellow dashed line. The breakout entry levels are depicted with the cyan lines located at a distance of 10% of the channel’s height from the borders. The target levels are shown as the green lines at 100% of the channel’s height distance. The
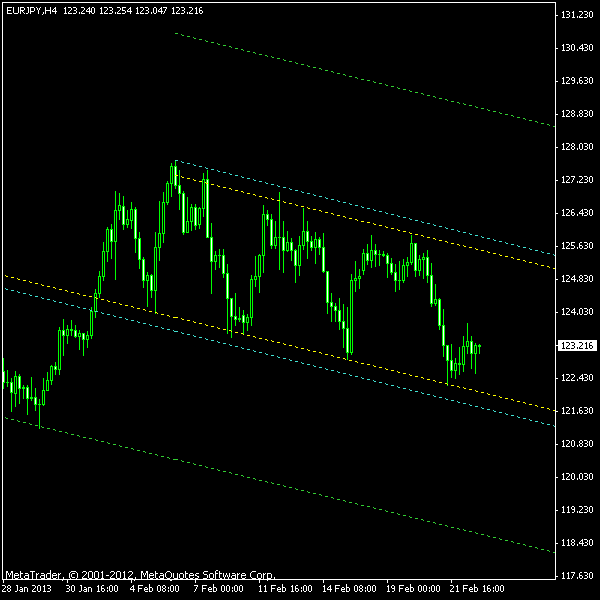
You can download my MetaTrader 4 chart template for this EUR/JPY pattern. You can also use this channel script to draw similar patterns using your own custom percentage levels.
Update 2013-02-25 19:40 GMT: Unexpectedly, a low probability bearish breakout has occurred. The sell stop order was triggered at 121.59 40 minutes ago.
Update 2013-03-07 15:35 GMT: 15 minutes ago, the trade has gotten stopped out at 123.99 level due to EUR/JPY rally. As I have said, I do not like short trades on descending channels. Should avoid them in future.
If you have any questions or comments regarding this descending channel on EUR/JPY chart, please feel free to post them via the form below.