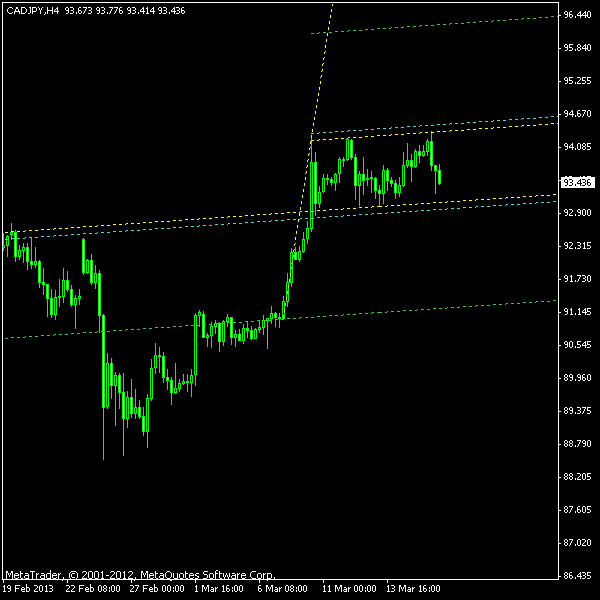
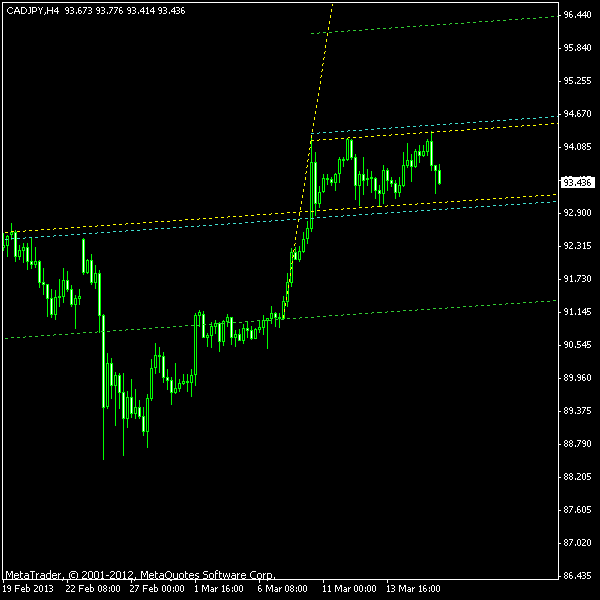
A less traded currency pair is now showing a bullish flag Forex pattern on its 4-hour chart. You could draw it either from March 7 (normal pole) or from February 25 (a pretty stretched pole). The flag part, which is actually an ascending channel of its own, lasts since March 8. One trading week is a good time period for 4-hour flag pattern to mature, in my opinion. CAD/JPY with its big spread (7 pips from my broker) and this bullish flag with its treacherous upward slope seem to be warning us, traders, against using this trade setup, but I still believe that it is a nice opportunity to get into a trade with a decent TP/SL ratio combined with a sufficient probability of success.
The screenshot below shows a flag delimited with yellow dash lines. Cyan entry levels are placed at 10% distance of the channel’s (flag part) height, while the green target lines are positioned at 100% distance of the whole pattern’s height. I will enter only
You can download my MetaTrader 4 chart template for this CAD/JPY pattern. You can then use our
Update 2013-03-17 22:29 GMT: The currency pair gapped down a lot. Had to remove the pending order because the gap has made this setup untradable.
If you have any questions or comments regarding this bullish flag on CAD/JPY chart, please feel free to post them via the form below.