
Less than a month has passed since my last reported bullish flag (on CAD/JPY @ H4). That time, it failed to come into play as the weekend gap had positioned the price significantly below the flag’s corridor. This time, the pattern is displayed in daily EUR/CAD chart and should resist weekend gaps more robustly. The pattern’s flagpole starts on the trading session of April 4 and lasts only two days, which is perfectly fine for a bullish flag pattern. The flag part consists of only 6 days, which can be considered as insufficient by some conservative chartists.
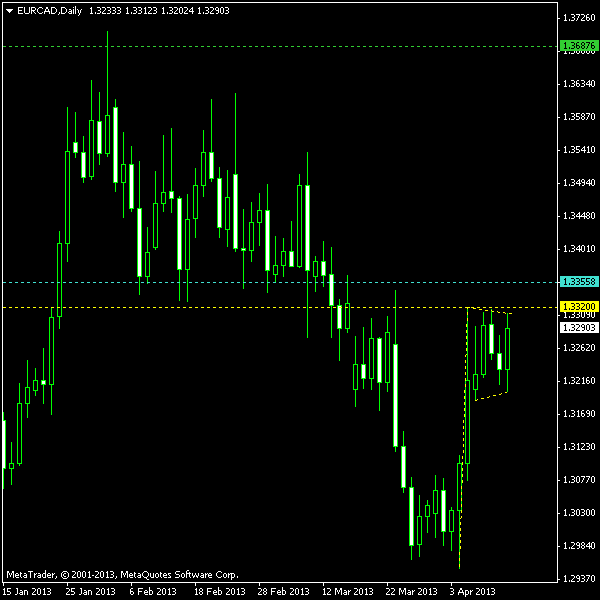
You can see the pole and the flag pattern marked with the yellow dash line on the chart screenshot below. The entry (cyan line) is positioned at 10% of the flagpole’s length above the highest point. The profit target (green line) is positioned at 100% of the flagpole’s length from that point. Only upward breakout will be used as a trading signal with this bullish flag. I will set my
You can download my MetaTrader 4 chart template for this EUR/CAD pattern.
Update 2013-04-15 10:45 GMT: Pending
Update 2013-04-25 21:02 GMT: Position has got stopped out after reaching only half of the planned target and consolidating a bit. Closed at
If you have any questions or comments regarding this bullish flag on EUR/CAD chart, please feel free to submit them via the form below.