
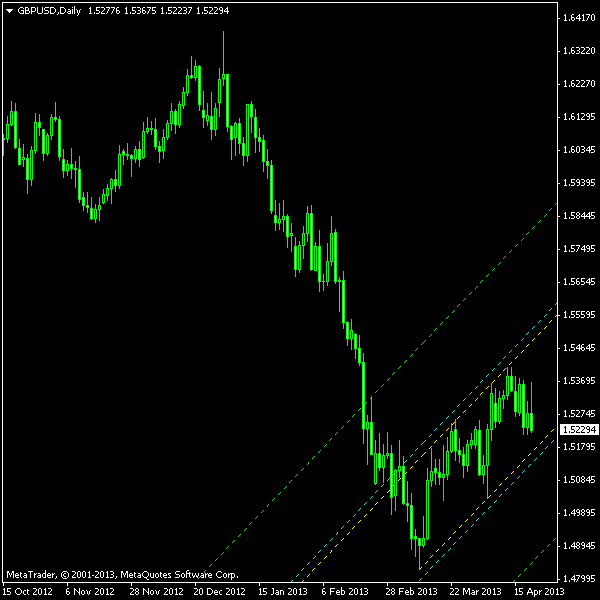
A rather promising ascending channel has formed on GBP/USD D1 chart. More than a month long, it fits the parallel border lines pretty accurately, with enough touches both on the upper and the lower one. The pattern appears at the end of a sharp decline, confirming its continuation nature.
The chart screenshot shows the channel borders in yellow, potential breakout entry points in cyan and the
You can download my MetaTrader 4 chart template for this GBP/USD pattern.
Update 2013-05-10 16:50 GMT: After charting another complete bullish wave inside the channel, the price has finally triggered my entry point at 1.53174 just about one and a half hours ago.
Update 2013-05-21 19:41 GMT: Here comes my first successful trade this year. Position closed at TP at 1.51203 more than three hours ago.
If you have any questions or comments regarding this ascending channel on GBP/USD chart, please feel free to submit them via the form below.