
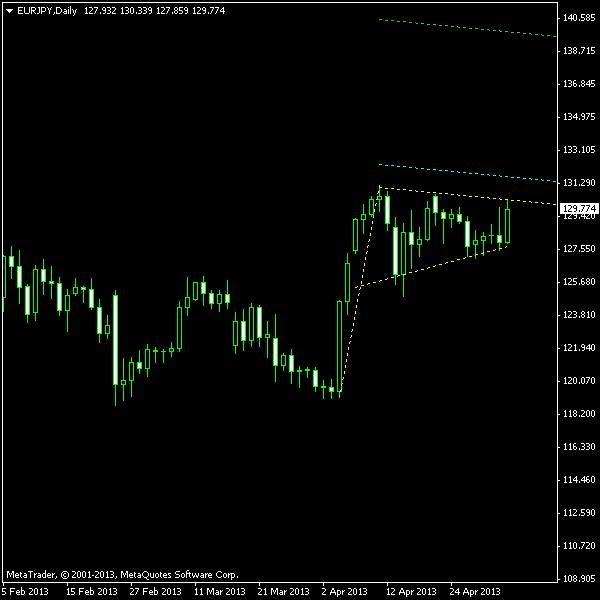
Daily EUR/JPY chart shows a minor pennant formation. It is not a very powerful example of a chart pattern, but with the continuing yen weakness and a seeming predisposition of the FX investors to favor euro, it may provide a nice bullish entry signal. The “pole” bar of the pennant has formed on April 4, and the pennant part has been forming for about 3 weeks.
The chart below shows the pole and the pennant marked with the yellow lines. The cyan line above the pattern shows a bullish breakout entry level located at 10% of the pole’s height above the upper border. The green line is a target positioned at 100% of pole’s height added to the
You can download my MetaTrader 4 chart template for this EUR/JPY pattern. It can be traded using my free Chart Pattern Helper EA.
Update 2013-05-09 21:47 GMT: Entered buy position at 17:56 GMT. Entry level was at 131.428,
Update 2013-06-03 16:37 GMT: Position closed with loss at 129.783 because bearish EUR/JPY position triggered on a more recent rectangle pattern.
If you have any questions or comments regarding this bullish pennant on EUR/JPY chart, please feel free to submit them via the form below.