
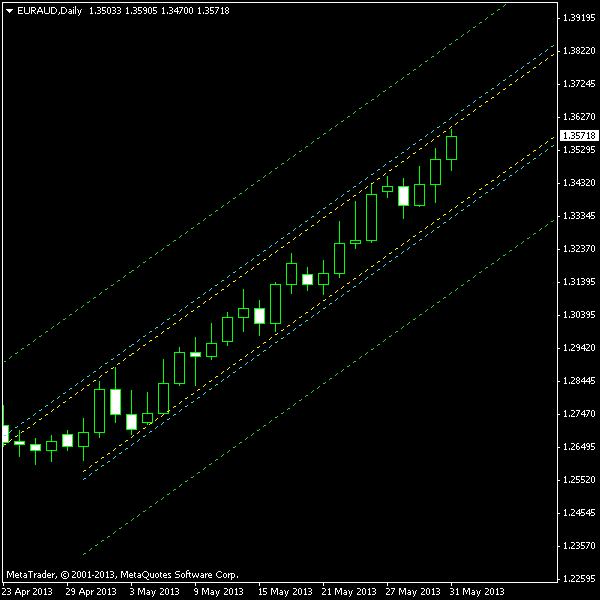
Today’s EUR/AUD pattern can be traced back to April 24, and the pair’s growth totals nearly 1,000 pips in that period. There have been numerous touches of both borders to confirm the validity of the channel. The biggest problem with this chart formation is that it does not follow a descending trend, whereas classical ascending channel is just a temporary correction for a bearish rally. Nevertheless, I will trade this pattern and will try to earn what little pips it has to offer.
As always, the pattern itself is marked using the yellow lines. The cyan lines represent the entry levels positioned at 10% of the channel’s height from the borders. The green lines represent the target levels positioned at 100% of the channel’s height from the borders. I will consider only bearish breakouts and will use the high of the breakout candle as my
You can download my MetaTrader 4 chart template for this EUR/AUD pattern. You may also use my free Chart Pattern Helper EA to trade this pattern.
Update 2013-06-04 05:07 GMT: Short EUR/AUD position triggered yesterday at 16:56 GMT. The entry price was 1.33879 with
Update 2013-06-04 10:04 GMT: Another failed trade today as EUR/AUD retraces back beyond the breakout bar’s high. Position closed at 1.35447 about an hour ago. CHF/JPY pennant trade is still pending.
If you have any questions or comments regarding this ascending channel on the EUR/AUD chart, please feel free to submit them via the form below.