
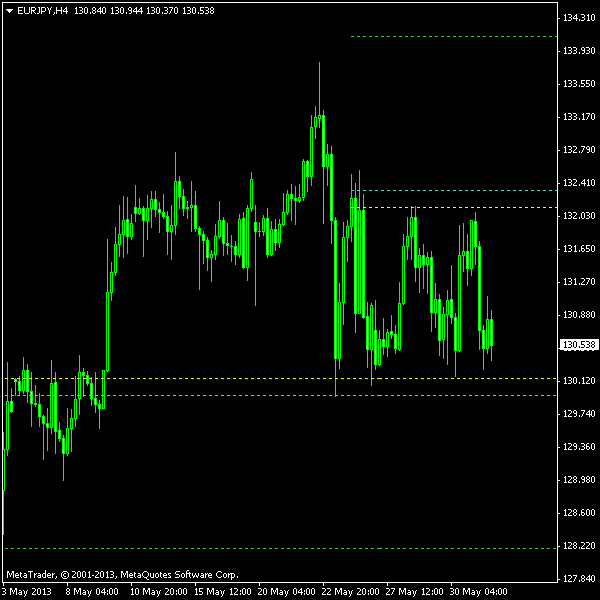
While the position opened using the bullish pennant pattern breakout on EUR/JPY is still running, the currency pair formed a new figure on a shorter timeframe. The rectangle, which spans from May 24 and is about 200 pips high, is a
The image below shows the rectangle with two horizontal yellow lines. At the distance of 10% of its height, the cyan lines are positioned for potential entry. Green lines at 100% height from the yellow lines are the potential
You can download my MetaTrader 4 chart template for this EUR/JPY pattern. It can be traded using my free Chart Pattern Helper EA.
Update 2013-06-03 16:40 GMT: Entered short position at 13:23 GMT. The entry price is 129.963;
Update 2013-06-04 6:21 GMT: Position exited via
If you have any questions or comments regarding this rectangle on EUR/JPY chart, please feel free to submit them via the form below.