AUD/JPY Shows Barely Formed Flag Pattern

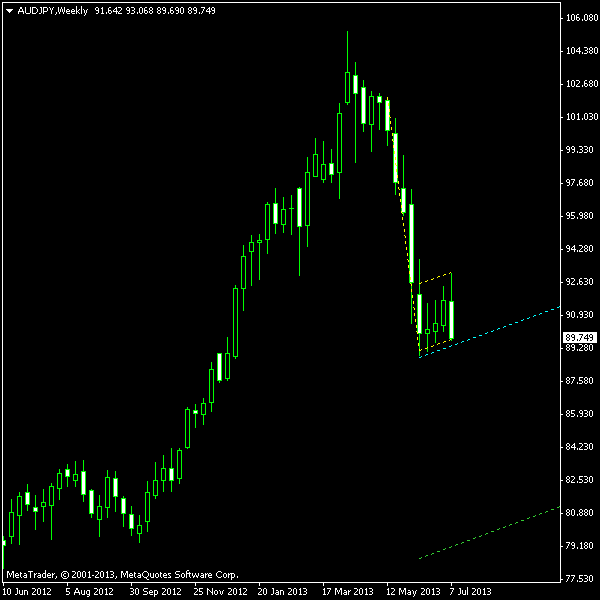
It looks like a bearish flag pattern has almost formed on AUD/JPY chart. Although it looks like one, the consolidation part may be considered too short for a complete flag figure — only 4 bars. Then, 4 bars is nearly one month on a weekly chart, so the price is stabilizing for quite some time now.
The flag’s pole is rather long (single yellow line), starting in early May. Consolidation phase has been entered in mid-June. It is marked with two parallel yellow lines on the chart below. Cyan line serves as the bearish entry signal and is plotted 10% of the consolidation channel’s height below the border. The target line is a green one and is plotted at the pole’s length distance from the upper border of the consolidation channel. Only bearish breakout will be considered here as flags are continuation patterns. I really like flags and pennants because they offer pretty nice risk-to-reward ratio.

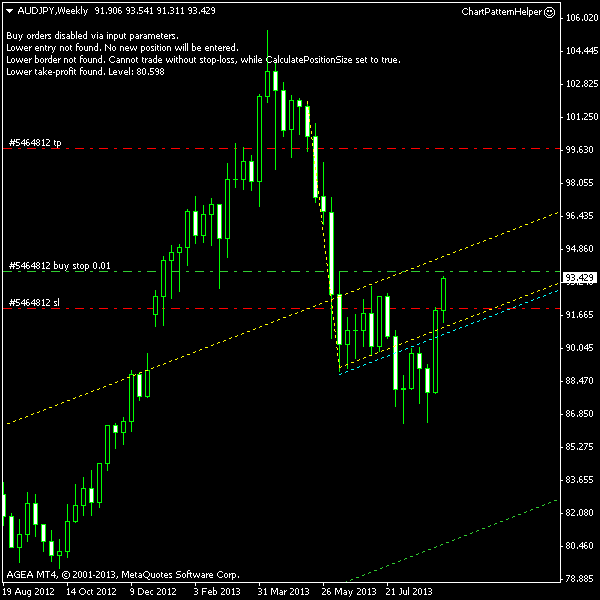
You can download my MetaTrader 4 chart template for this AUD/JPY pattern. It can be traded using my free Chart Pattern Helper EA.
Update 2013-07-22 04:39 GMT: Short position triggered at 17:55 GMT yesterday. The entry price is 89.841, stop-loss was set to 92.748. Current take-profit level is 79.687. Reward-to-risk ratio is crazy here, but the chances for a winning trade are rather slim too, though breakout still looks valid as of now.
Update 2013-09-10 04:25 GMT: Closed at stop-loss of 92.748 at 9:14 GMT today. Looks like a sort of a double bottom pattern has formed following the flag pattern breakout. The position could definitely benefit from some sort of trailing stop-loss. Post-exit chart:


If you have any questions or comments regarding this bearish flag on AUD/JPY chart, please feel free to submit them via the form below.

Leave a Reply

Your email address will not be published. Required fields are marked *

− two = seven