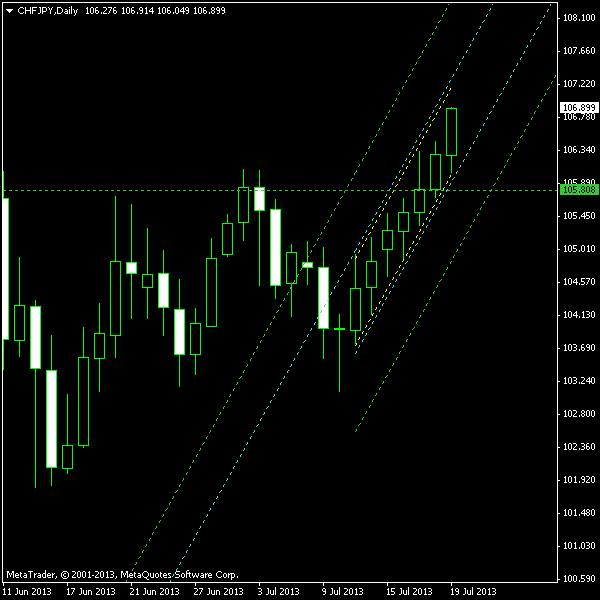
CHF/JPY daily chart is now showing a curious example of an ascending channel pattern. It is composed purely of bullish candles. It is a 7-day period of
Although the pattern itself is marked as usually: yellow lines make up the border, cyan lines — entry levels (10% buffer zone), and inclined green lines — targets (100% of channel’s height), there is one new element on the chart below. It is a horizontal green line drawn at the the next support level. In case of a downside breakout of the channel, I will use either horizontal or sloped green line as my

You can download my MetaTrader 4 chart template for this CHF/JPY pattern. It can be traded using my free Chart Pattern Helper EA.
Update 2013-07-22 06:34 GMT: Short position triggered at 0:00 GMT today. The breakout candle looks very strong but it has already pulled back close to the entry point — not a perfect situation, but it is still not bad. The
Update 2013-07-24 12:36 GMT:
If you have any questions or comments regarding this ascending channel on CHF/JPY chart, please feel free to submit them via the form below.