
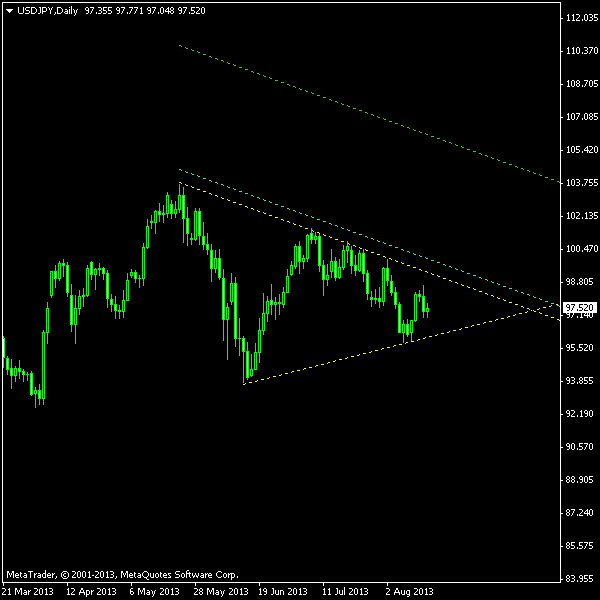
A chart pattern that is currently showing up on the daily USD/JPY chart can serve as an example of a
This pattern follows a rather long bullish trend and suggests a continuation on breakout, thus only upper breakout will be considered. As you can see on the chart below, the yellow lines mark the borders of the triangle, the cyan line marks the entry point, and the green line marks the exit point. Of course, they are purely hypothetical, but, nevertheless, I will be using them in my live Forex account. I will set my
You can download my MetaTrader 4 chart template for this USD/JPY pattern. It can be traded using my free Chart Pattern Helper EA.
Update 2013-09-02 07:27 GMT: Long entry triggered at 98.695 just an hour ago. With
Update 2013-09-20 16:00 GMT:I apologize for such a late update, but this position closed about two days ago following the surprising Fed announcement. The exit price was 97.88. Here is the

If you have any questions or comments regarding this symmetrical triangle on USD/JPY chart, please feel free to submit them via the form below.