
The double top formation is visible on the daily EUR/AUD chart since at least September 4. Unfortunately, I failed to recognize it as a fully formed pattern. Perhaps, that was not such a bad mistake considering the price action that followed afterwards. Currently, the currency pair shows two rather different entry setups that exploit the same pattern. Today, when I finally turned my mind to this double top, I spent about 30 minutes deciding, which of the two trade setups to post about. Finally, I decided that both deserve your attention.
Broken Neckline
Although it is normally called support line in double top patterns, I prefer calling it neckline as in
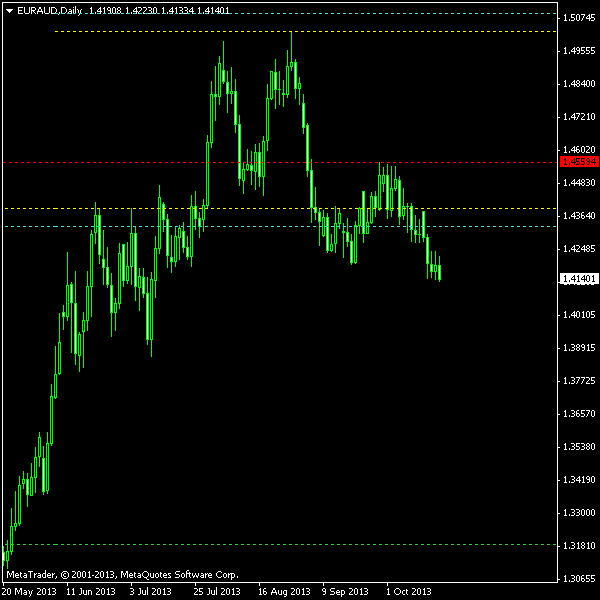
You can download my MetaTrader 4 chart template for this setup on EUR/AUD pattern.
Update 2013-10-21 04:14 GMT: Entered short EUR/AUD position at 1.4144 about 7 hours ago with this setup. The
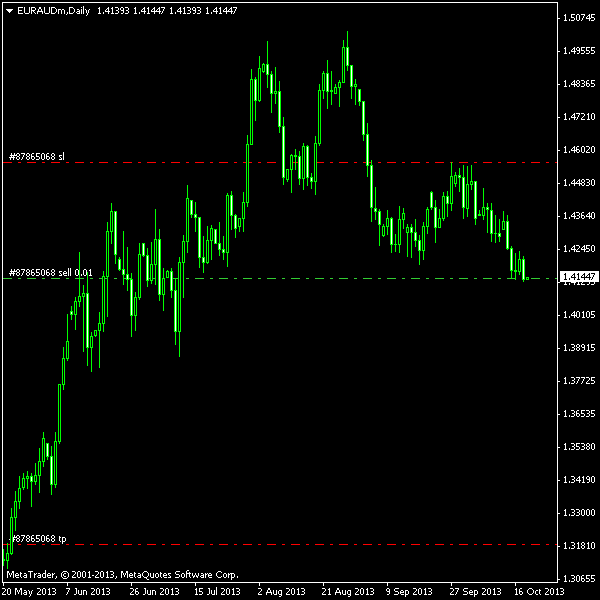
Update 2013-11-21 17:28 GMT: Position exited at
Sloped Entry
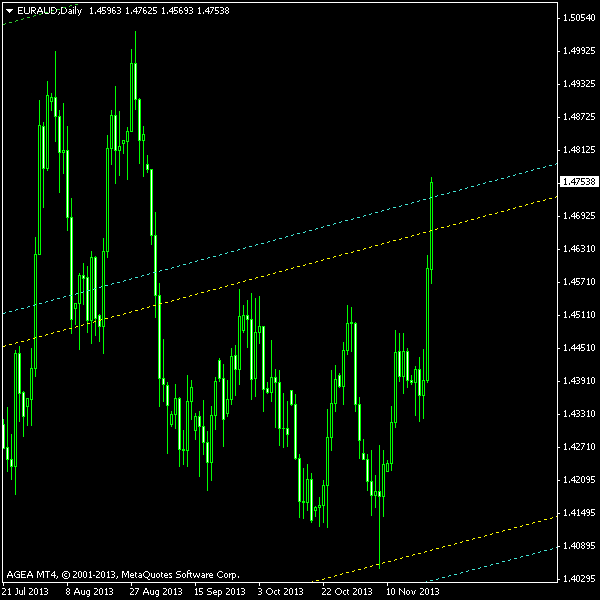
This one looks more like a traditional chart pattern setup I usually post about. The whole double top pattern is supported by an ascending channel here. So, the neckline support (top yellow line) is an upper border of the channel. The new confirmation line for breakout is the channel’s bottom border. And there is also a confirmation entry point for the confirmation breakout level — the lower cyan line! As you can see, this setup is very conservative. It has also a much more modest TP level (green line) that ascends with time.
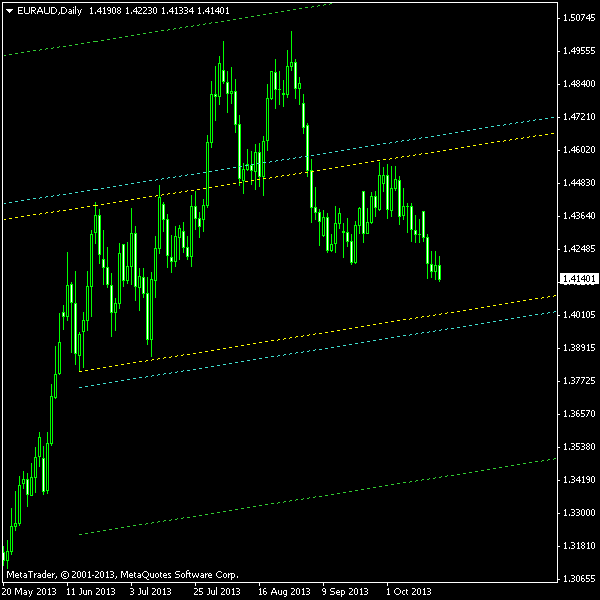
You can download my MetaTrader 4 chart template for this setup on EUR/AUD pattern. It can be traded using my free Chart Pattern Helper EA.
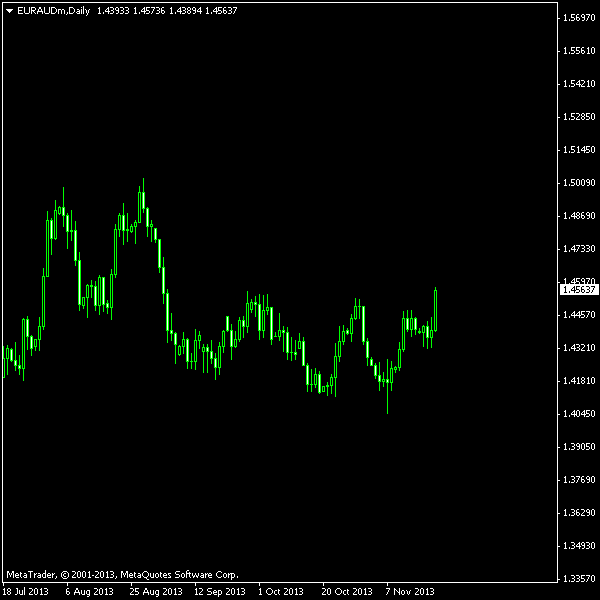
Update 2013-11-22 10:55 GMT: I have just cancelled this pattern’s pending order as the price had already broken through the channel’s top border. I believe that neither the original double top pattern nor the ascending channel subpattern are valid now. Please see the latest screenshot of the relevant EUR/AUD chart:
Which One to Trade?
I will trade both setups. I will enter the first trade manually and will use an expert advisor for a proper entry, SL and TP management on the second one. As both trades are highly correlated — same pair, same chart pattern, just slightly different entry and exit rules — I will use half of my usually position size on them (based on 1% of account balance risk).
If you have any questions or comments regarding this double top on EUR/AUD chart, please feel free to submit them via the form below.