
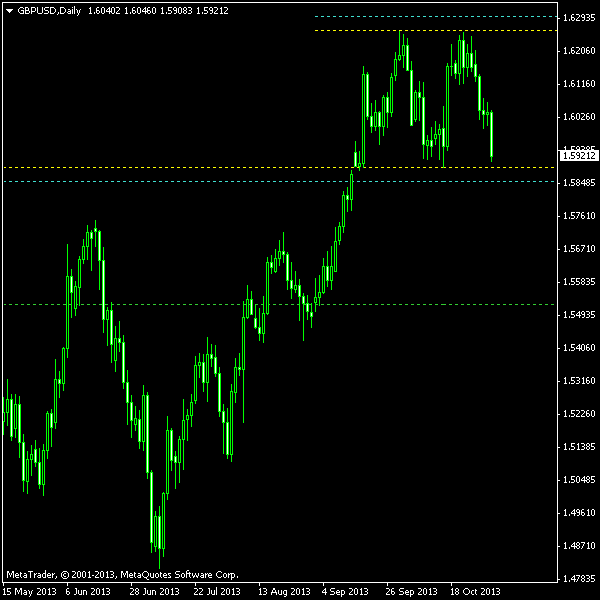
EUR/AUD is not the only pair forming a double top recently. If you look at the daily chart of the Pound vs. Dollar pair, it is easy to notice that the price has hit a significant resistance near the prominent twin tops (October 1 and October 23). The resulting double top pattern is an opportunity to cash out on the trend retracement of the bullish wave that lasted since July 9 this year (there was a nice ascending channel trade on GBP/USD D1 during that trend).
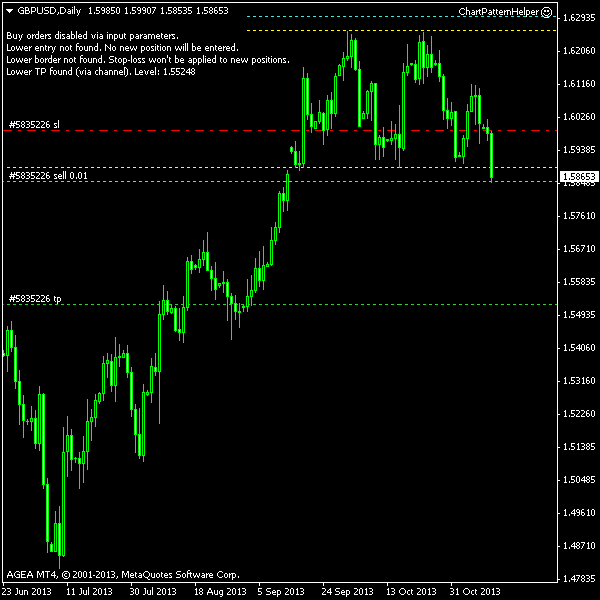
The chart below depicts a trade setup generated by my ChannelPattern script with pattern’s height channel taken as a guide. The double top is delimited with yellow lines. The entry level is shown with a cyan line. The
You can download my MetaTrader 4 chart template for this GBP/USD pattern. I will use my free Chart Pattern Helper EA to trade this pattern.
Update 2013-11-12 9:57 GMT: Sell order triggered at 1.58558 at 09:31 GMT today.
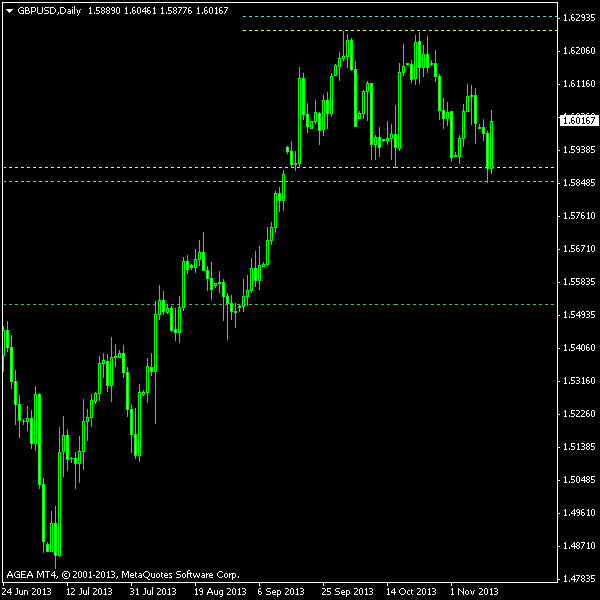
Update 2013-11-13 19:18 GMT: Looks like the unemployment report from the United Kingdom has killed my position. The trade failed as the currency pair retraced back to
If you have any questions or comments regarding this double top on GBP/USD chart, please feel free to submit them via the form below.