NZD/JPY Shows Ascending Channel with Unclear Consequences

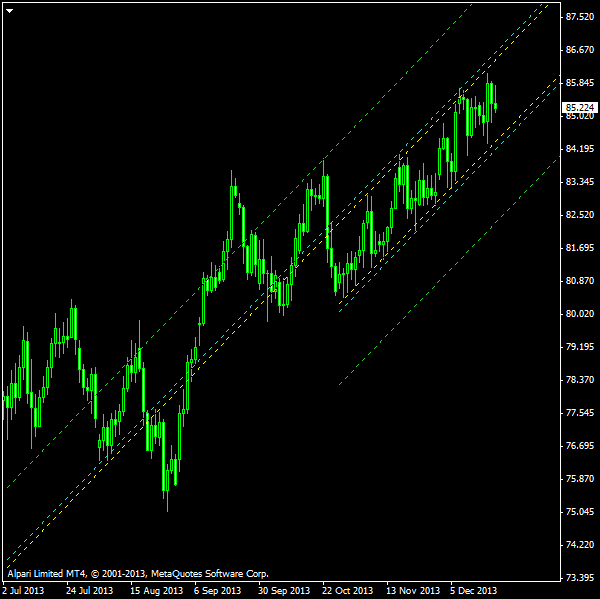
NZD/JPY pair is currently showing a rather well-defined ascending channel pattern on its daily chart. A downward breakout from this channel will most probably mean a significant correction in the currency pair’s medium-term uptrend. An upward breakout would mean an intensification of the bullish rally, which I would not count as a reliable signal.
The yellow channel borders delimit the channel on the chart below. The cyan entry levels are placed above and below the borders with a 10% (of channel’s height) buffer zone. The green take-profit levels are built parallel to the rest of the channel’s lines. I would not consider a breakout to the upside from this pattern for trading. I will only trade a bearish breakout, setting my stop-loss to the high of the breakout bar.

The SL and TP levels depicted above have been built using my Channel Pattern script. You can download my MetaTrader 4 chart template for this NZD/JPY pattern. I will use my free Chart Pattern Helper EA to trade this pattern.
Update 2014-01-18: Entered short position at 86.144 at 15:45 GMT yesterday. Stop-loss is set to 87.138, while the current take-profit is at 84.347, which means that the risk-to-reward ration far from great. Moreover, it will decline as the target will move up with the channel’s slope. There was not much price action since the entry:

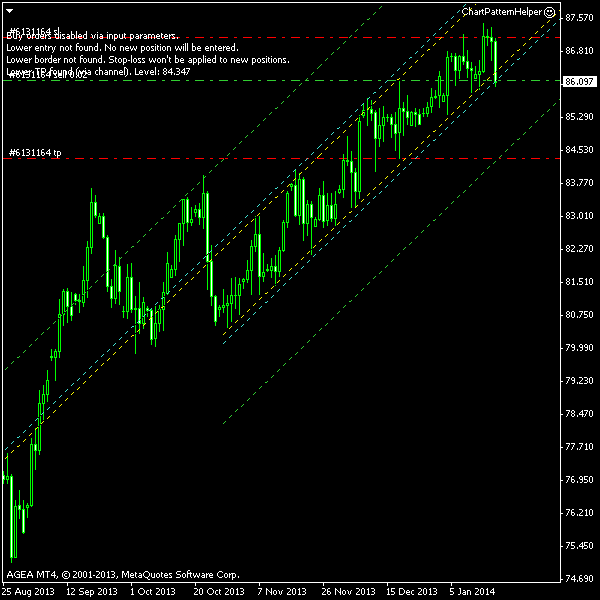
Update 2014-01-21 17:55 GMT: Trade closed at stop-loss at 01:14 GMT today. A rather sharp upward spike produced my first loss this year:


If you have any questions or comments regarding this ascending channel on NZD/JPY chart, please feel free to submit them via the form below.

Leave a Reply

Your email address will not be published. Required fields are marked *

sixty one + = 67