
EUR/USD has formed a downward channel on its daily chart. The currency pair is declining since March 19, following an uptrend that lasted for a month and a half. It is now natural to expect a tradable bullish breakout from the current channel pattern.
As you can see on the image below, the descending channel is marked with the yellow borders. The entry level that I will use is located above the upper border and is marked with the cyan line. My potential
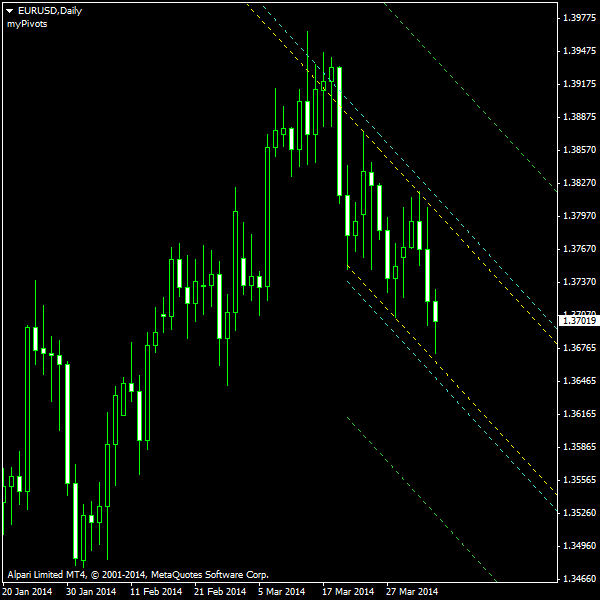
The SL and TP levels depicted above have been built using my Channel Pattern script. You can download my MetaTrader 4 chart template for this EUR/USD pattern. I will use my free Chart Pattern Helper EA to trade this pattern.
Update 2014-04-08 16:28 GMT: Long position triggered at 1.37945 just four hours ago.

Update 2014-04-11 09:05 GMT:

If you have any questions or comments regarding this ascending channel on EUR/USD chart, please feel free to submit them via the form below.