
Market sentiment shows the current disposition of traders relative to specific currency pairs. While futures
Contents
- 1 Oanda
- 2 ForexFactory
- 3 DailyFX
- 4 Saxo Bank
- 5 Dukascopy
- 6 OrderFlowFX
- 7 My Choice and Poll
You would need to get info from several brokers to get a more precise picture of the situation with sentiment because brokers base their sentiment values on their client base, which is limited even at big companies. Below, you will find descriptions of some of the most popular online Forex sentiment meters.
Oanda
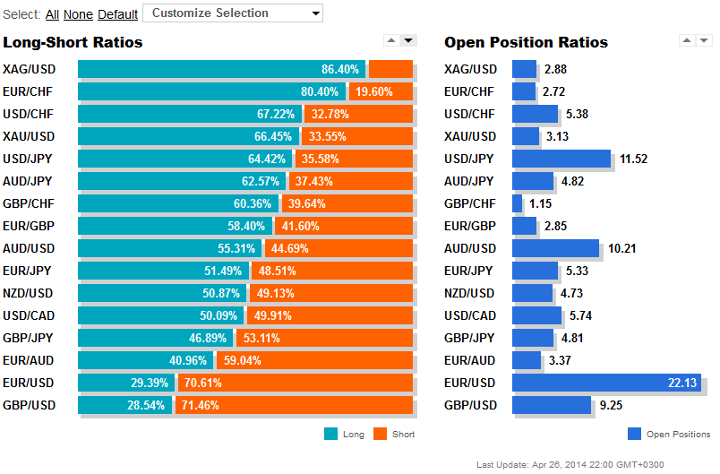
Open Position Ratios show the long/short ratios for the positions in 14 currency pairs and two metals (silver and gold): AUD/JPY, AUD/USD, EUR/AUD, EUR/CHF, EUR/GBP, EUR/JPY, EUR/USD, GBP/CHF, GBP/JPY, GBP/USD, NZD/USD, USD/CAD, USD/CHF, USD/JPY, XAG/USD and XAU/USD.
In addition to long/sort ratios, you can check the percentage share of each of the
Order Book shows the number and the price levels of open orders and positions for a given trading instrument. Information can be accessed for any of the past 24 hours. The order/position book view is offered in three types of views:
In any of the three views, the price scale can be zoomed in and out.
The information is updated every 20 minutes.

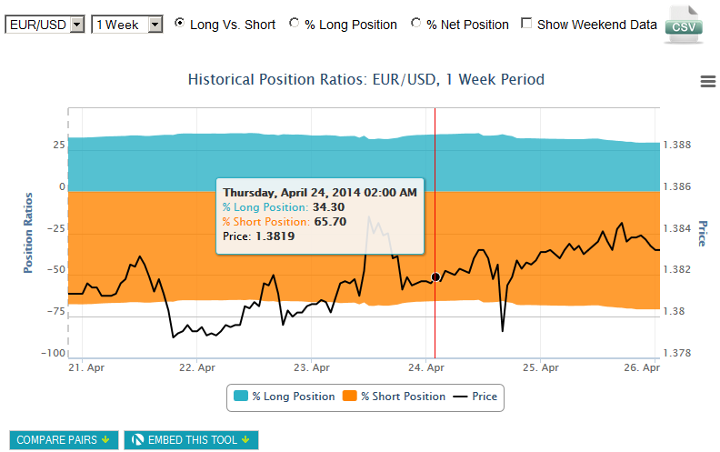
You can use Oanda‘s Historical Open Orders and Historical Position Ratios for

ForexFactory
Positions / Live Accounts indicator shows a breakdown of long/short traders and lots for 10 currency pairs at a time. By default they are: EUR/CHF, GBP/USD, USD/JPY, USD/CHF, USD/CAD, AUD/USD, NZD/USD, GBP/JPY, EUR/GBP and EUR/JPY. However, they can be changed to almost any other currency pairs. The numbers are presented in a very accessible manner.

Additionally, it is possible to view the details for an individual currency pair. They include Traders, Lots, Average Entry Price, Average Trade Duration, Winning Trades and Losing Trades. All values are broken down into longs, shorts and total. The details also show a chart for lots/traders in M5, H1 or D1 timeframe. There are about 40 hours of data available for M5, 30 days for H1 and a year for D1. The scale can be switched either to normal (percentage) or to relative mode.
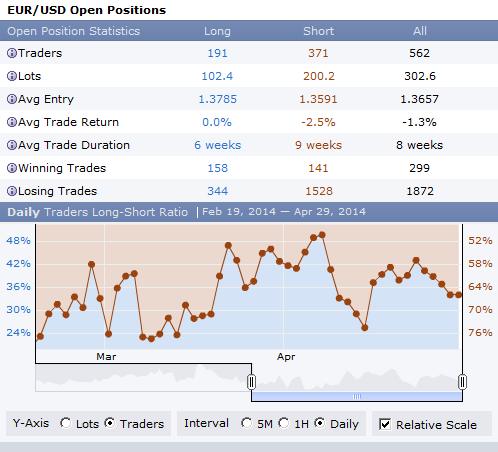
A breakdown of community members and the sizes of their positions is visible below the details chart. This breakdown can also be switched to entry prices mode, showing the average entry rates of those positions. While many members protect their positions with privacy settings, some share their trades fully.

ForexFactory is not a broker but a community website for traders. Nevertheless they are able to offer their own sentiment meter. Its biggest problem is that it is based on the accounts of the traders who voluntarily signed up with ForexFactory and connected their live account to the website. This results in a limited and somewhat biased sample.
DailyFX
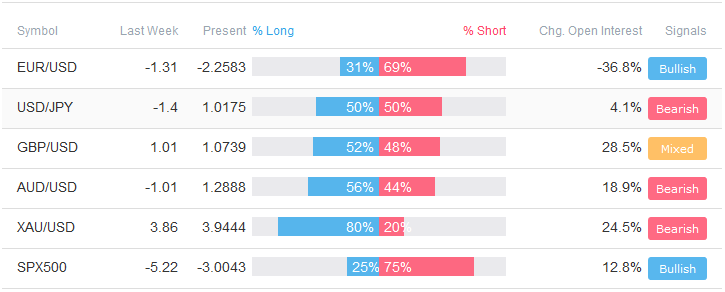
Speculative Sentiment Index is a sentiment metric based on number of traders who are long and short on a given Forex instruments. It is based on the data from the FXCM IG live account holders. The data is updated in
The data includes SSI for the current week, SSI for the last week, percentage of Long contracts, change in open interest and a trading signal generated by this info. The data is given for EUR/USD, USD/JPY, GBP/USD, AUD/USD, EUR/JPY, Gold, and S&P500.
A 6-month long daily chart can be invoked for any of those trading instruments. In addition to the main price curve, the chart features SSI ratio histogram and Retail Open Long/Short Positions lines.

Update 2017-11-15: DailyFX is a part of IG now. The description above has been updated to reflect that and also the changes in the SSI data displayed.
Saxo Bank
Provided by Saxo Bank, Forex Open Orders and Forex Open Positions charts offer order data similar to Oanda’s. The basic mode is
The following data is provided for each of the 10 supported currency pairs (AUD/USD, EUR/CHF, EUR/GBP, EUR/JPY, EUR/USD, GBP/JPY, GBP/USD, USD/CHF, USD/JPY and XAU/USD):
Aggregated Open Orders. Order sizes and buy/sell ratios. It is a single diagram for all currency pairs. Clicking on a currency pair name will bring up three other charts:
Saxo Bank:
TradingFloor: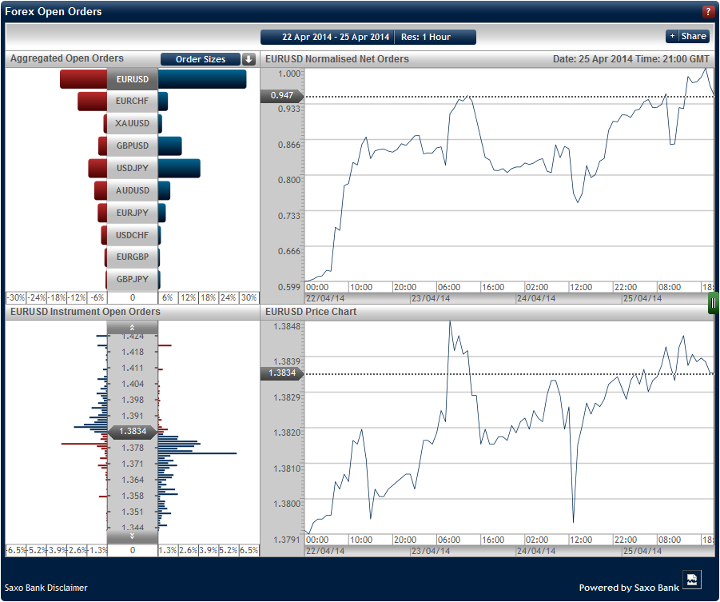
Aggregated Position Ratios. Position sizes and long/short ratios. It is a single diagram for all currency pairs. Clicking on a currency pair name will bring up three other charts:
Saxo Bank:
TradingFloor: TradingFloor.com
15-minute charts are available for a maximum horizon of 1 month, 1-hour data can be scaled out up to 6 months and there are 5 years of data for 1-day resolution.
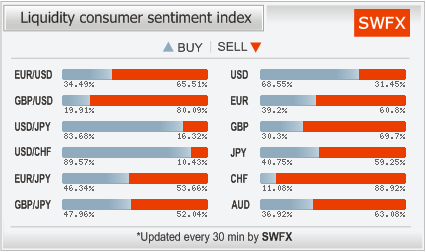
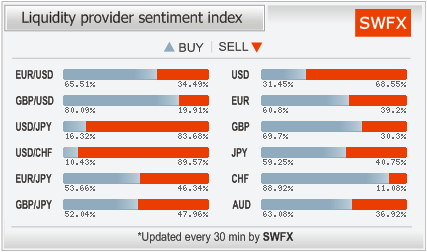
Dukascopy
SWFX is a short form of Swiss Forex Marketplace — an ECN network provided by Dukascopy. The main advantage of SWFX Sentiment Index is that it is divided into two parts — Liquidity Consumers and Liquidity Providers. The former are comprised of regular traders, money managers and hedge funds. Even if they use limit and stop orders, they are counted as liquidity consumers as they do not do it on a regular basis. Providers are banks and currency marketplaces who regularly set up bids and offers for other participants to trade on. Each trade in one category has a corresponding trade in another one.
Each category features both the current sentiment index and its historical version. The current index presents the percentage shares of buy and sell positions for a given currency pair or currency. The historical index shows
The data is displayed for 6 currency pairs (EUR/USD, GBP/USD, USD/JPY, USD/CHF, EUR/JPY and GBP/JPY) and 6 currencies (USD, EUR, GBP, JPY, CHF and AUD).
The indicators are updated every 30 minutes.
Liquidity consumers:

Liquidity providers:

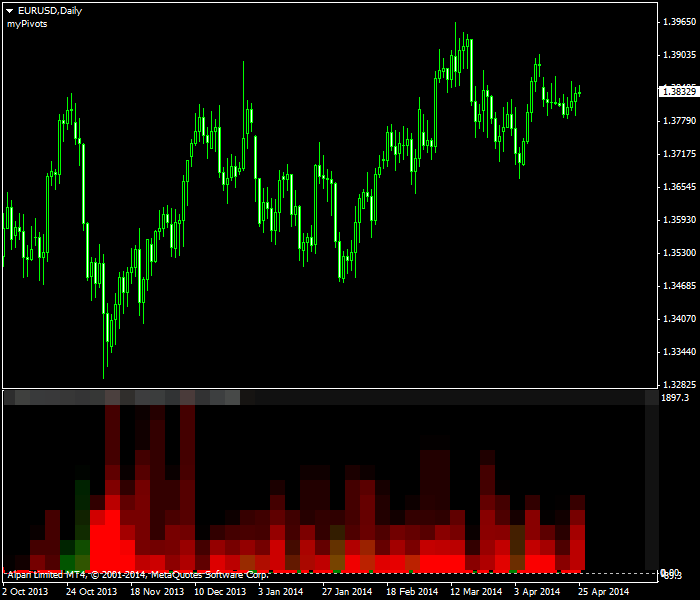
OrderFlowFX
OrderFlowFX presents a set of indicators for MetaTrader 4 platform to show sentiment analysis of the Forex market. The indicators use custom proprietary data, which is downloaded by a special external script (coded in Python) and provided by OrderFlowFX. Unlike other sentiment indicators presented here, this service is paid. They charge $69/month for using OrderFlowFX indicators. They also offer free 7-day trial to evaluate the product. There are 12 indicators in the package. Below, I present the most interesting ones in terms of the sentiment analysis. As of May 4, 2015, the company stopped providing its services to new customers. They also requested for their screenshots to be removed hence the blurred graphics on the images below.
Cumulative Position History offers a histogram of buyers and sellers at a particular bar of the chart:

Net Cumulative Position History features the same data but buyers and sellers are subtracted to produce a histogram where one bar is presented only by one color — either buyers or sellers:
Institutional Cycles measures the activity of buyers and sellers. It is a sort of momentum indicator for institutional sentiment. Large abrupt changes in the indicator signal a change in general sentiment towards the currency pair:

Long/Short Position Pressure indicators show the number of long/short positions in the market:

Open Position Volume Profile shows cumulative volume of all open positions at a given price level:

Open Positions shows the number of long/short positions by date:

Pending Stops shows the number of pending stop orders by price levels. It is an indispensable tool in finding the true support and resistance levels based on sentiment analysis:

The data is available for the following trading instruments: EUR/USD, GBP/USD, USD/CHF, USD/JPY, EUR/CHF, USD/CAD, AUD/USD, EUR/GBP, EUR/AUD, EUR/JPY, NZD/USD, GBP/JPY, AUD/JPY, EUR/CAD, Crude Oil, Gold (XAU/USD), S&P500 and Silver (XAG/USD).
Both installation and usage process is not very straightforward. Such indicators are less convenient for
Update 2015-05-08: After being acquired by another company, OrderFlowFX has stopped providing its service to new clients on May 4, 2015.
My Choice and Poll
I personally, prefer Oanda’s Open Position Ratios to track situation with the EUR/CHF sentiment. I am currently looking to increase my long position, but I am hesitant to do so while the vast majority of the retail traders are on the long side of the trade. And how do you use sentiment indicators?
![]() Loading …
Loading …
If you would like to share your own methods of gauging the current sentiment of the currency traders or discuss any of the tools mentioned above, please feel free to do it using the form below.