
Nine months after my post about the ascending triangle on CHF/JPY, the currency pair has finally given some more or less clear signal on what it is going to do next. Judging from the definite uptrend preceding the current symmetrical triangle formation, the bullish breakout is highly probable.
The yellow lines on the image below show the borders of the symmetrical triangle. The cyan line is my entry level that is positioned at the distance of 10% of the triangle’s height from the upper border. The green line is the potential
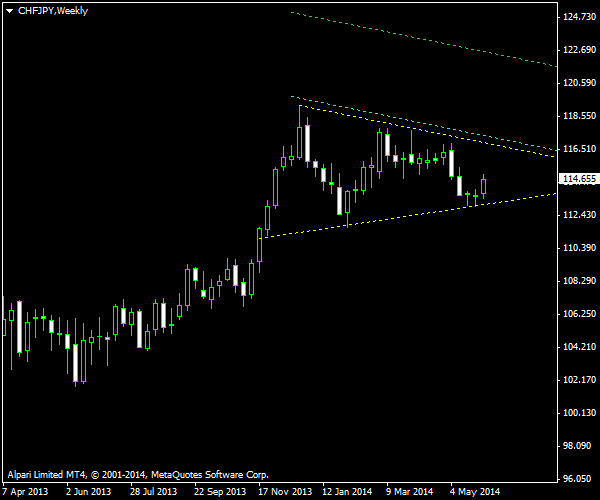
The chart was built using the ChannelPattern script. You can download my MetaTrader 4 chart template for this CHF/JPY pattern. It can be traded using my free Chart Pattern Helper EA.
PS: The long position triggered by the previous pattern on CHF/JPY (post) is still open. I will not close it with this new pattern because they both point in the same direction. However, the old position will use its own
Update 2014-07-21 13:10 GMT: I decided to cancel this pending order and abandon this chart pattern today because the price has clearly broken below the lower side of the symmetrical triangle:

If you have any questions or comments regarding this symmetrical triangle on CHF/JPY chart, please feel free to submit them via the form below.