
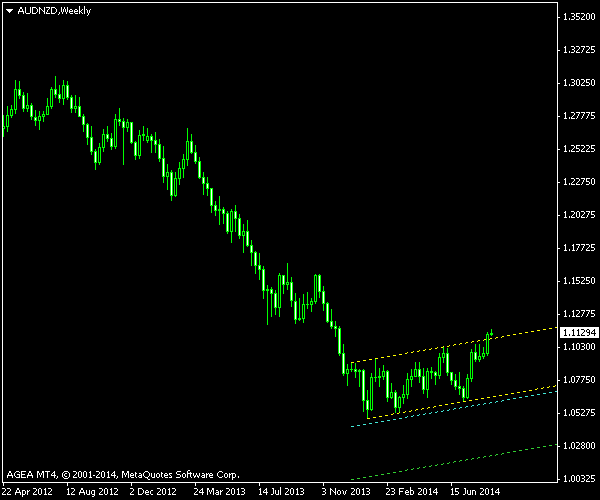
There is nothing special to the AUD/NZD channel that has formed on the currency pair’s weekly chart, except for that it is a classic piece of an ascending figure with a high probability of a downward breakout. The channel has formed as a correction wave of a 30 months old downtrend. The channel itself is almost 8 months long.
I have marked the channel’s borders with the yellow lines on the chart below. The cyan line will be my breakout trade entry level. I have placed it at the distance equal to 10% of the channel’s height below the lower border. The green line will serve as an ascending

The chart was built using the ChannelPattern script. You can download my MetaTrader 4 chart template for this AUD/NZD pattern. It can be traded using my free Chart Pattern Helper EA.
Update 2014-08-25 15:18 GMT: I have cancelled the pending order because the currency pair had broken the upper border of the channel, invalidating the pattern:
If you have any questions or comments regarding this ascending channel on AUD/NZD chart, please feel free to submit them via the form below.