
An
The yellow borders seen on the image below mark the channel itself. Cyan line is my entry level for a bearish breakout. I will only use a sell trade signal generated from this channel and will ignore a bullish breakout because I do not consider upward breakouts of the ascending channels as reliable. Target level is at the green line, which is drawn at 100% of the channel’s height below the lower border.
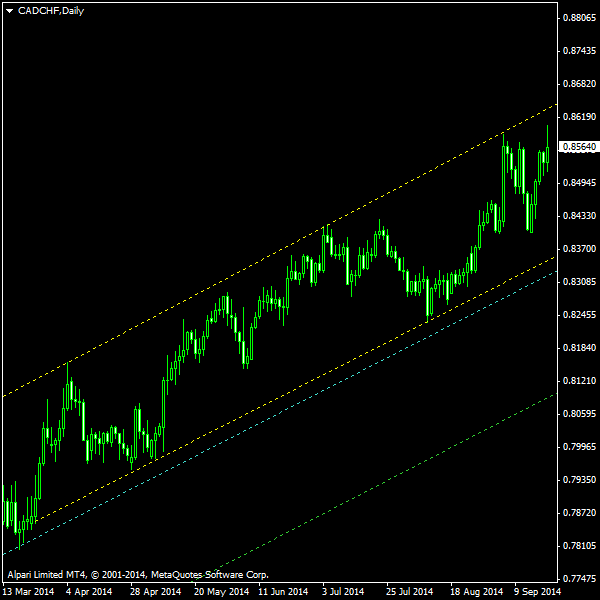
The channel was detected using the Channel Pattern Detector indicator. The chart was built using the ChannelPattern script (with some manual corrections). You can download my MetaTrader 4 chart template for this CAD/CHF pattern. It can be traded using my free Chart Pattern Helper EA.
Update 2014-10-18: Sell order triggered at 0.83922 this Wednesday. The
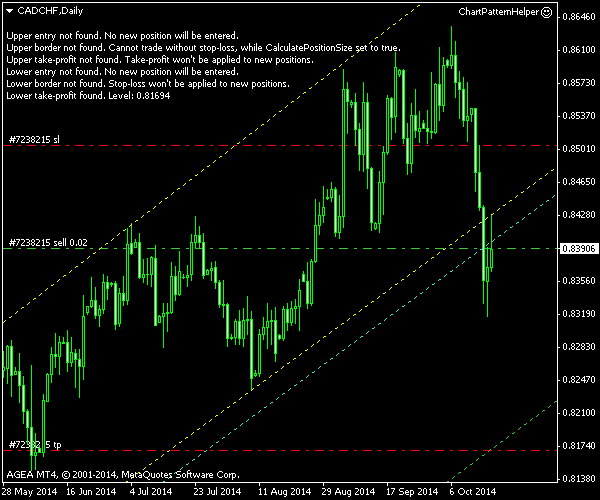
Update 2014-10-26: Trade exited by
If you have any questions or comments regarding this ascending channel on CAD/CHF chart, please feel free to submit them via the form below.