
Less than a month ago, I have already posted about the same chart pattern on the same currency pair and even on the same timeframe. That time, the trade setup has been executed successfully and the position ended up in profit the same week the trade was opened. This time, GBP/JPY is trading slightly above those levels after experiencing a
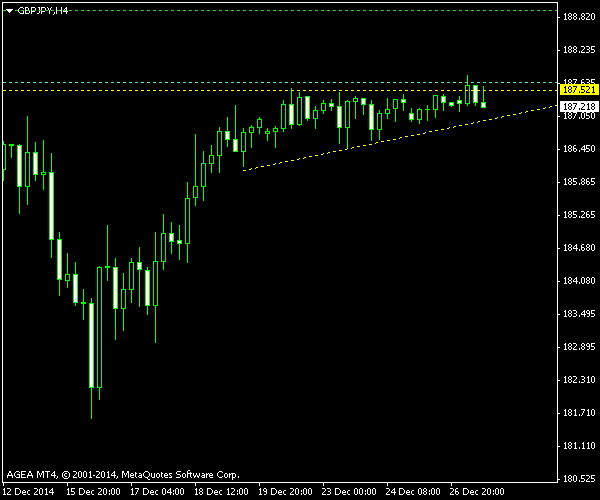
The yellow lines mark the triangle borders on the chart screenshot below. The cyan line is the entry positioned at 10% of the triangle’s height above the upper border. The green line is the target level position at 100% of the triangle’s height above the border. Bearish breakouts are ignored in this setup. An ascending triangle appearing after an upward trend is a purely bullish signal.
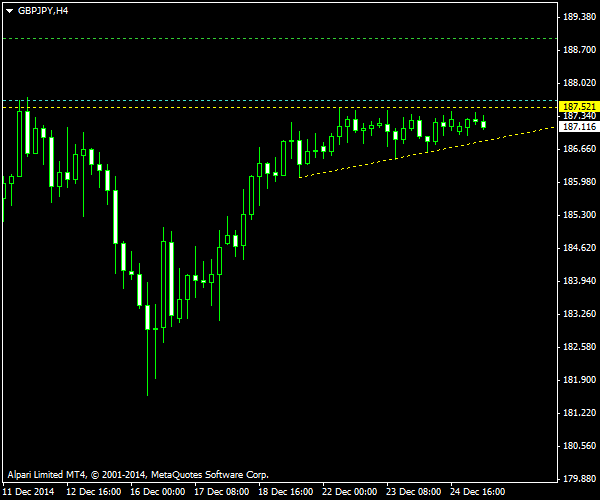
The chart was built using the ChannelPattern script. You can download my MetaTrader 4 chart template for this GBP/JPY pattern. It can be traded using my free Chart Pattern Helper EA.
Update 2014-12-29 16:45 GMT: The trade had triggered at 1:03 GMT today, but the breakout turned out to be very weak, and the price has pulled back to
If you have any questions or comments regarding this ascending triangle on GBP/JPY chart, please feel free to submit them via the form below.