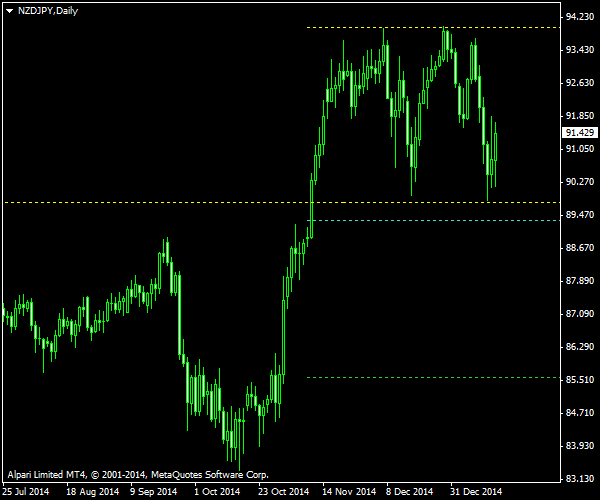
NZD/JPY is showing a great bearish breakout opportunity that has crystallized now when the double top formation on the daily chart can be seen clearly. It appears to be terminating a strong rising trend that was active since
The chart shows the double top pattern with two yellow lines — the upper one is marking the peaks, while the lower one is forming a pattern’s ‘neckline.’ If you look at the latter, you can see that it is slightly declined, which is a warning sign for this kind of patterns, but it is relatively small enough to ignore. The cyan line is my breakout entry point, and the green line is my target profit level. I will place my

The chart was built using the ChannelPattern script. You can download my MetaTrader 4 chart template for this NZD/JPY pattern. It can be traded using my free Chart Pattern Helper EA.
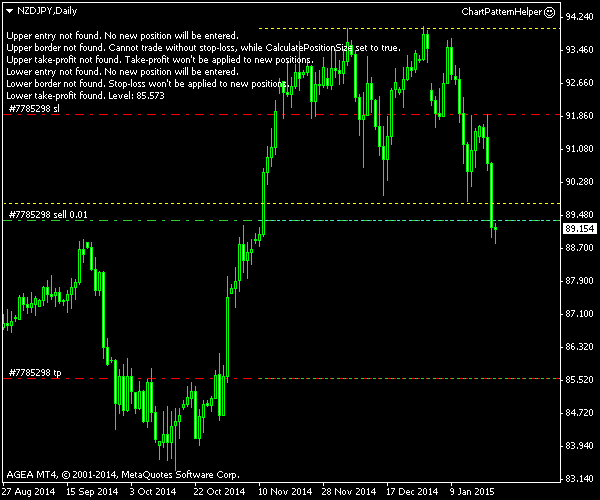
Update 2015-01-22: It did not take long for the breakout to happen. The trade has triggered yesterday at 89.355.
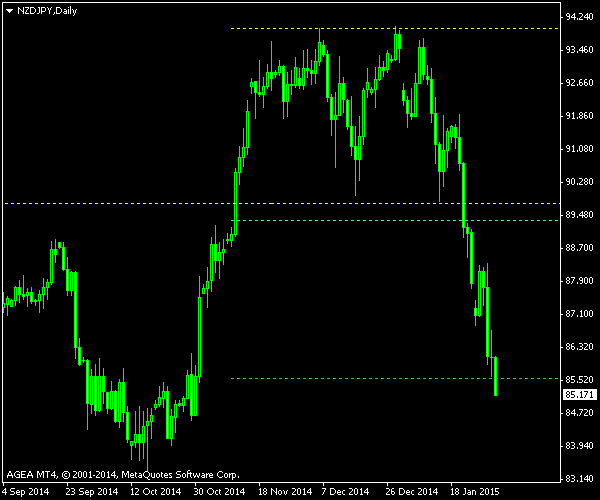
Update 2015-01-30 10:36 GMT: This double top pattern proves profitable as the currency pair has hit my
If you have any questions or comments regarding this double top on NZD/JPY chart, please feel free to submit them via the form below.