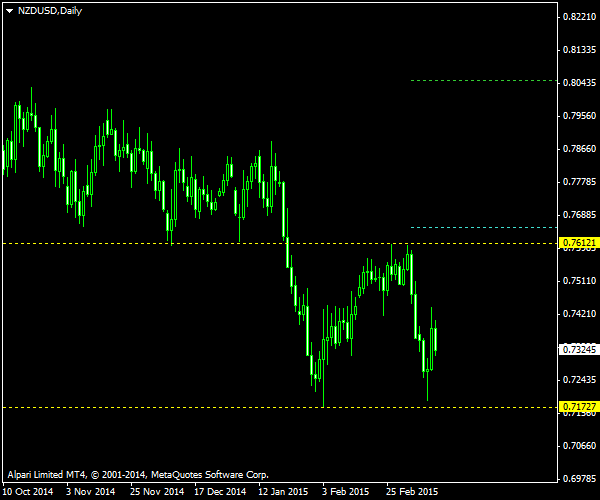
NZD/USD is trending downwards since July of 2014. The currency pair was moving in strong waves until it had met its support near 0.7170 level on February 3 this year. Then, it has failed to set up a new lower low in its attempted fall on March 11. The resulting chart pattern is an almost classic version of double bottom, which is a strong bullish signal. The only significant disadvantage of this DB occurrence is that the first bottom is somewhat longer in time than the second one appears to be as of now.
The formation is outlined on the screenshot below. The bottom yellow line marks the two troughs — the main indicator of a double bottom pattern. The upper yellow line depicts a kind of a neckline, which marks the

The chart was built using the ChannelPattern script. You can download my MetaTrader 4 chart template for this NZD/USD pattern. It can be traded using my free Chart Pattern Helper EA.
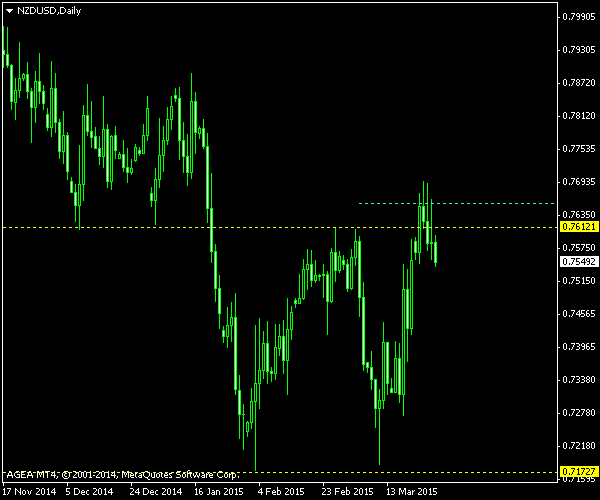
Update 2015-03-23 8:37 GMT: Bullish breakout trade triggered on an upward spike about four hours ago. The entry level is 0.76575, the

Update 2015-03-27 9:31 GMT: The pair’s
If you have any questions or comments regarding this double bottom on NZD/USD chart, please feel free to submit them via the form below.