Despite the discouraging failures of my most recent two attempts to earn from the chart patterns, I still plan continuing with my strategy further. The euro/pound pair is on a verge of breaking the neckline of its
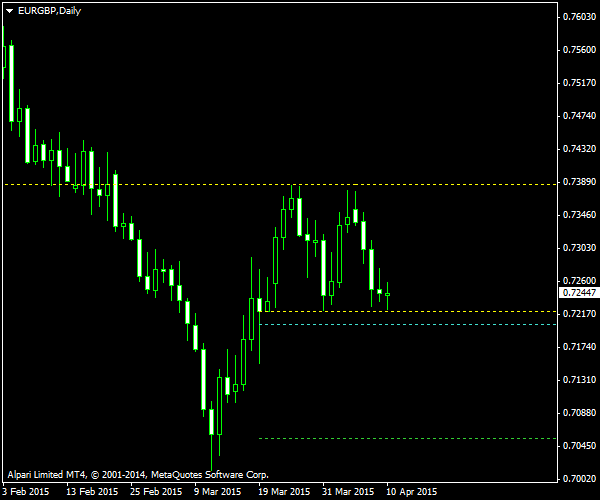
The pattern is very smooth. You can see the tops and the neckline marked with the yellow border channel on the image below. I will risk a short position entry on the break below the cyan line, which is at exactly 10% of the pattern’s height below the neckline. I will then set my

I have built this chart using the ChannelPattern script. You can download my MetaTrader 4 chart template for this EUR/GBP pattern. You can trade it using my free Chart Pattern Helper EA.
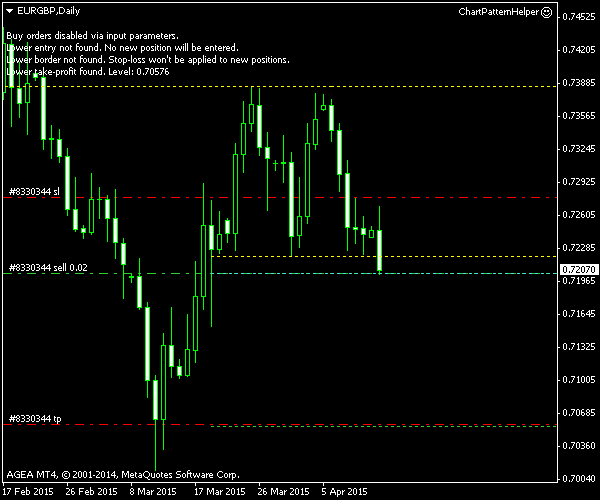
Update 2015-04-13 11:15 GMT: Sell order triggered at .0.72044 about 40 minutes ago. The
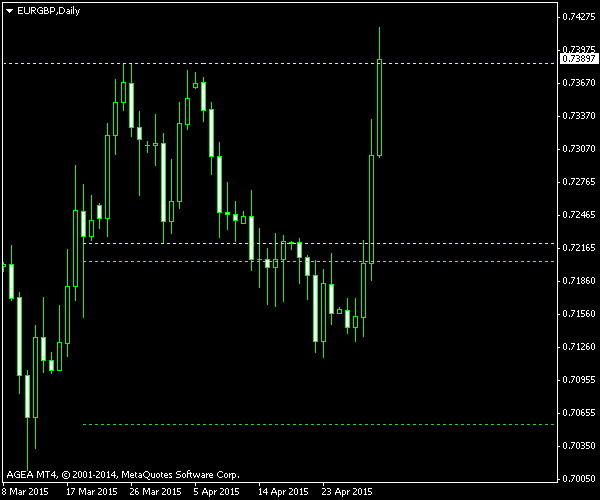
Update 2015-05-01: The trade was closed at
If you have any questions or comments regarding this double top on EUR/GBP chart, please feel free to submit them via the form below.