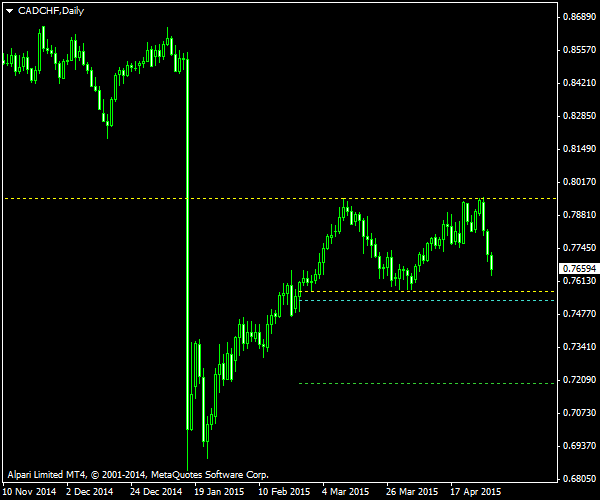
CAD/CHF is not one of the most popular Forex pairs, but I often observe some tradable technical patterns on its charts. The daily timeframe is currently showing a double top formation that looks to be capping the
You can see the pattern marked with the yellow lines on the screenshot below. The bottom yellow line denotes the neckline, while the upper one marks the peaks. The bearish breakout entry line is cyan, it is placed at 10% of the pattern’s height below the neckline. The green

I have built this chart using the ChannelPattern script. You can download my MetaTrader 4 chart template for this CAD/CHF pattern. You can trade it using my free Chart Pattern Helper EA.
Update 2015-05-07 9:56 GMT: The breakout trade has been entered at 0.75348 about 45 minutes ago with
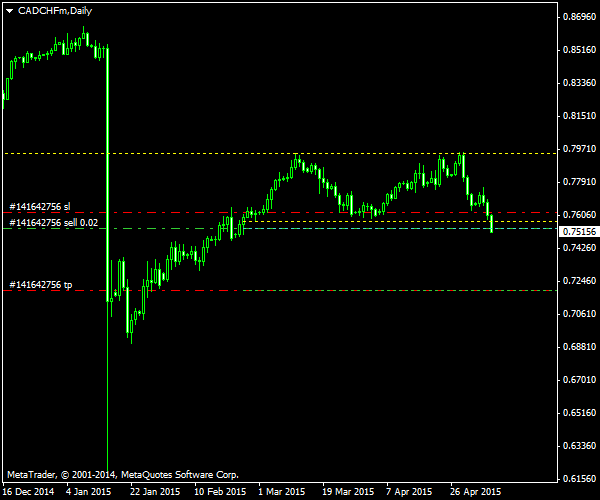
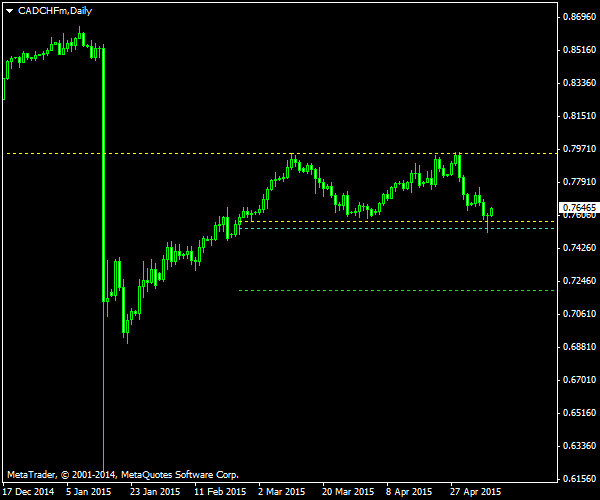
Update 2015-05-08: The trade lasted less than a day as the
If you have any questions or comments regarding this double top on CAD/CHF chart, please feel free to submit them via the form below.