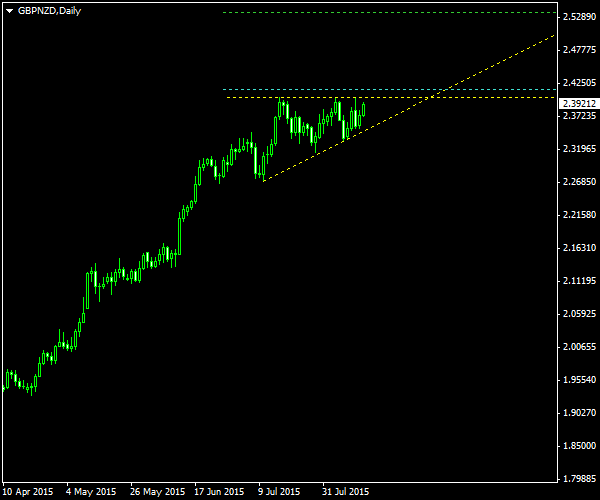
The double top pattern on GBP/NZD @ D1 chart that was spotted by me a week ago has transformed into a classic case of an ascending triangle. Although the double top pattern is not dismissed at this point (it can still work as a sort of a triple top formation), the new case offers a bullish breakout opportunity in addition to the bearish breakout of the previous pattern.
As you can see, the yellow lines form the borders of the triangle. The upper border is flat as it has to be for a valid ascending triangle. The lower border is inclined and is confirmed by three price hits. The cyan line is placed at 10% of the triangle height above as the buffer distance for a breakout entry. The green line is my potential

The chart was built using the ChannelPattern script. You can download my MetaTrader 4 chart template for this GBP/NZD pattern. It can be traded using my free Chart Pattern Helper EA.
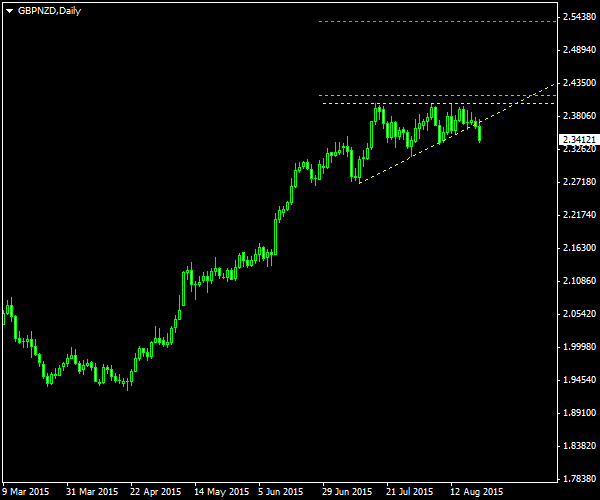
Update 2015-08-21 15:55 GMT: I have just discarded this trade setup as the ascending triangle had been clearly broken to the downside. It is no longer a valid signal. The double top pattern on GBP/NZD @ D1 chart still stands even though it looks more like a triple top now. Please see the latest screenshot of the relevant GBP/NZD chart:
If you have any questions or comments regarding this ascending triangle on GBP/NZD chart, please feel free to submit them via the form below.