
A popular advice directed at newbies is to focus on a single currency pair — to learn its traits, to see how it trends, to observe its flow through trading sessions, to get used to its volatility. Staying focused on one currency pair can definitely be useful, especially if you are scalping or trading on
Monitoring multiple charts presents a lot more opportunities to trade on compared to staying with one chart only. If your trading strategy does not require a lot of attention per chart analysis (i.e. you trade on H1 or higher timeframes), investing yourself into as many trading instruments as possible is the optimal way to go. With each new trading symbol, you increase the number of trades your system will undertake and with it (considering positive expectation per trade) you increase the overall result and its stability via lesser dependence on a single trade’s outcome.
There are four considerable disadvantages of going with as many currency pairs as your broker offers:
Lack of attention and proper analysis. If you try to take too much on yourself, you might start seeing trades where there is none, or miss good setups, which you would have noticed if not for the number of instruments you had to check through.
Overtrading becomes much easier when a trader has many charts to place unplanned trades. If you succumb easily to overtrading, using multiple charts is probably a wrong solution for you.
Correlation between currency pairs and between other assets is a serious issue to consider when you plan to enter a trade. If you follow two different signals on two correlated instruments at the same time, there is a chance that you are entering two trades driven by one factor, effectively doubling your position size without a good reason for doing so. This can have an undesirable effect your system’s performance. It is necessary to take into account the possible correlation when analyzing more than one chart.
Fundamental differences in trading symbols. The trading method that works perfectly on highly liquid
Of course, an experienced trader knows how to deal with such disadvantages and how to get around the obstacles presented by the large number of potential markets. Still, there are limits for managing even fully automated trading systems, so you will probably fail to trade on hundreds of instruments with consistent success unless you have access to some
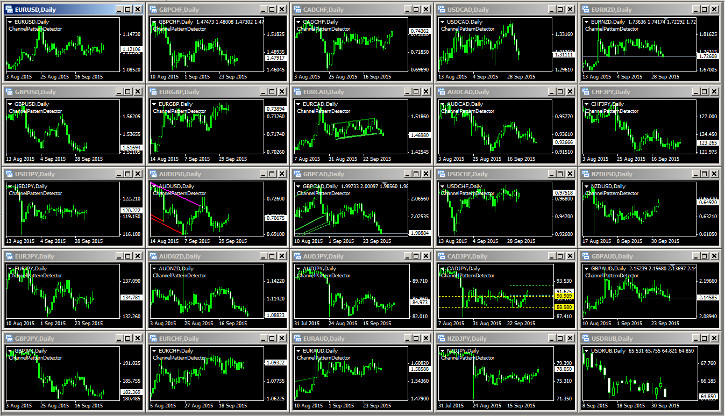
I personally, regularly check 33 trading instruments (24 currency pairs and 9 commodities) in my H4/D1/W1 analysis. Also, about once every month I monitor up to 5 more currency pairs of more exotic nature (e.g. USD/CNY), which in total amounts to just 38 trading instruments. It is not too much in a sense that I am not overwhelmed by the number of markets to stay
![]() Loading …
Loading …
If you want to explain how your trading routine goes about monitoring multiple charts, please feel free to do so using the form below.