
You can see a case of a rather uneven descending channel of the daily chart of EUR/CHF as of now. The channel takes its start following September’s peak, which marked the end of the 5-month bullish wave. The channel here represents a correction following an uptrend. Traders can use the upside breakout as a continuation signal. The only disadvantage in this specific pattern is the rate concentration near the upper border.
The channel itself is marked with the yellow lines on the screenshot below. The cyan line serves as the breakout entry — it is located at 10% of the channel’s height above the border. The green line is my declining
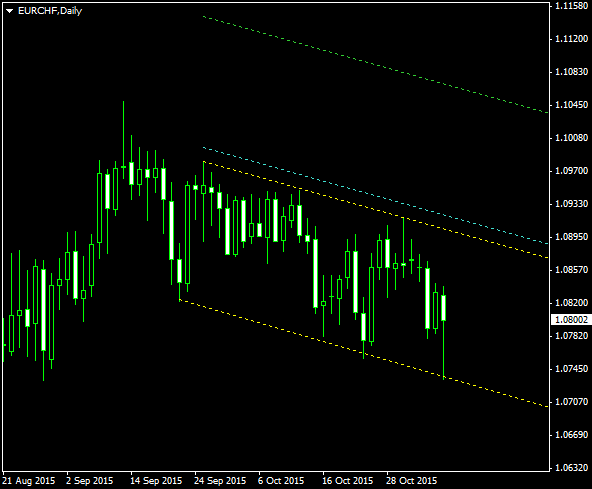
I detected this channel using the Channel Pattern Detector indicator and built this chart using the Channel Pattern Detector indicator. You can download my MetaTrader 4 chart template for this EUR/CHF pattern. You can trade it using my free Chart Pattern Helper EA.
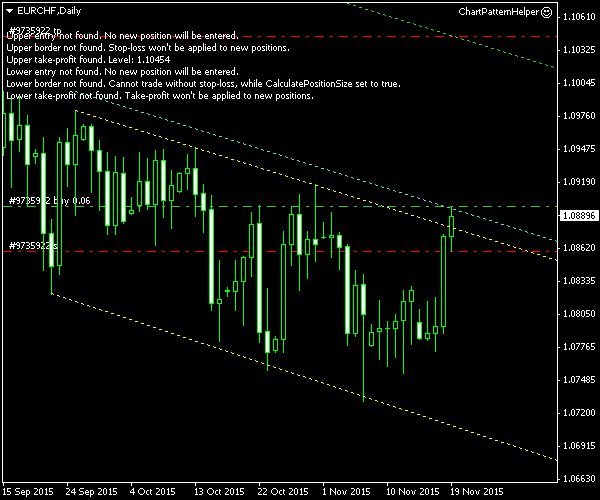
Update 2015-11-19 15:54 GMT: Long entry triggered at 1.08985 three hours ago. The
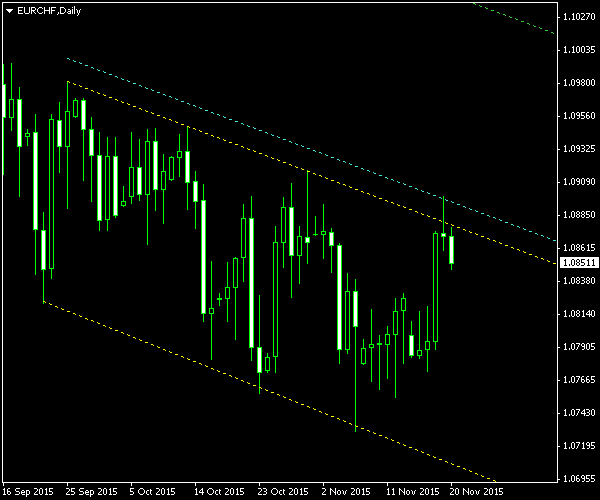
Update 2015-11-20 7:45 GMT: Exited by
If you have any questions or comments regarding this descending channel on EUR/CHF chart, please feel free to submit them via the form below.