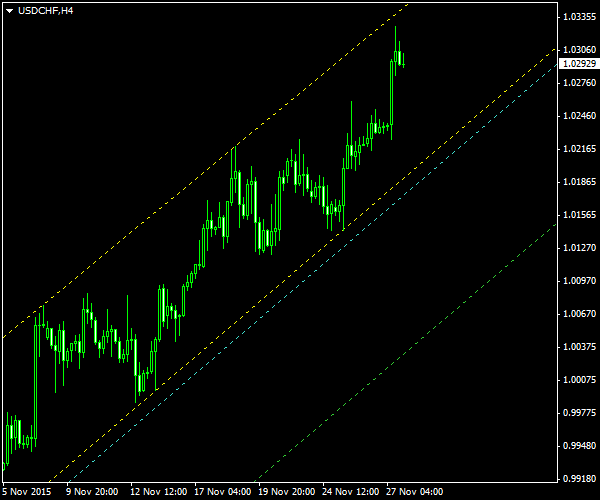
USD/CHF has entered a discernible ascending channel in late October this year. The pattern is most visible on 4-hour timeframe. It continues the major rally in the currency pair persistent since October 15. The channel has multiple border confirmations from the price and presents an opportunity to sell the USD vs. the franc if the lower border gives in.
The image shows the channel with its borders as yellow lines. The cyan line is the potential breakout entry point located at 10% of the channel’s height below the lower border. The green line is the

I detected this channel using the Channel Pattern Detector indicator and built this chart using the Channel Pattern Detector indicator. You can download my MetaTrader 4 chart template for this USD/CHF pattern. You can trade it using my free Chart Pattern Helper EA.
Update 2015-12-02 20:10 GMT: An abnormally long bearish candle has pierced the entry line at 17:46 GMT today. My sell opened at 1.02280 with
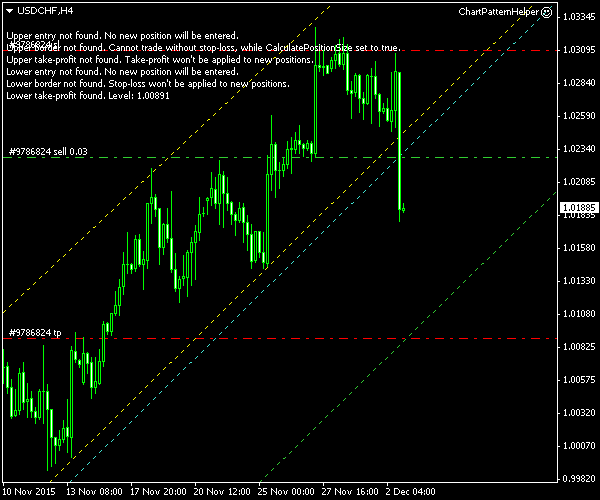
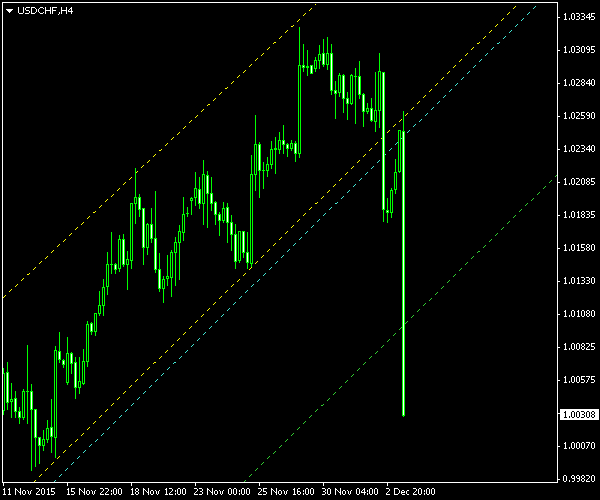
Update 2015-12-03 15:20 GMT: An even more abnormally long bearish candle has pierced the
If you have any questions or comments regarding this ascending channel on USD/CHF chart, please feel free to submit them via the form below.