A
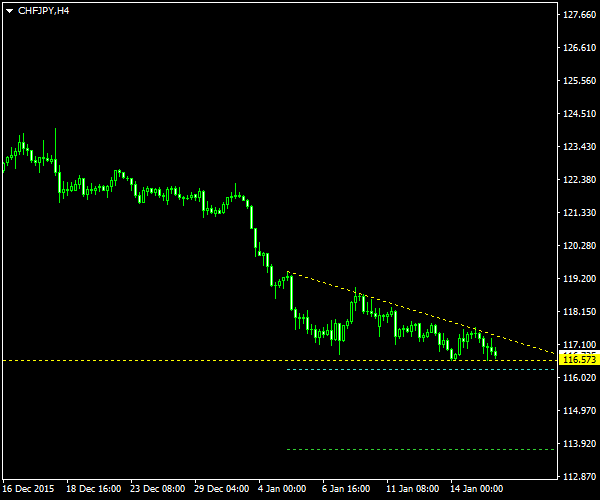
As you can see on the chart below, the triangle is marked with the yellow borderlines. The height (H) of the triangle is measured at its base. At 10% of H below the lower border, the cyan entry level is found. At 100% of H below the lower border, you can see the green target level. I will set my

I have used the ChannelPattern script to help me build the entry and exit levels for this setup. You can download my MetaTrader 4 chart template for this CHF/JPY pattern. You can trade it using my free Chart Pattern Helper EA.
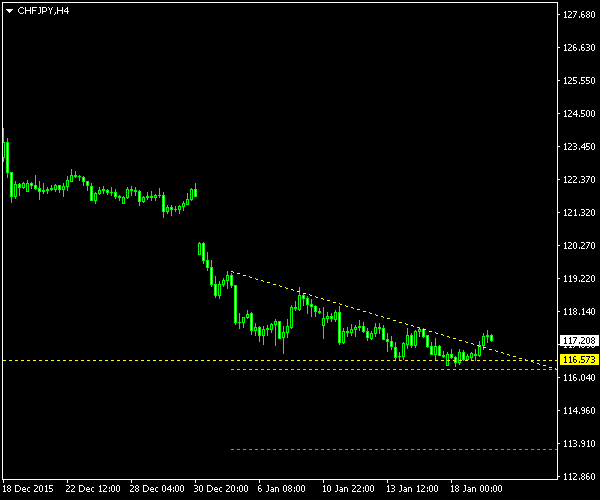
Update 2016-01-19 21:52 GMT: I have cancelled the pending trade due to the fact that the pattern is no longer valid.
If you have any questions or comments regarding this descending triangle on CHF/JPY chart, please feel free to submit them via the form below.