AUD/USD Finalizes Double Bottom on H4

The four-hour chart of the AUD/USD currency pair shows a consolidation of the price that resembles a classic double bottom pattern. The bearish wave preceding the formation lasted since December 31 through January 15. The pattern itself is just two weeks old and is rather rough — the bottoms are not that evident as there are many small spikes. Still, I will trade a bullish breakout from its borders as the potential reward looks promising.
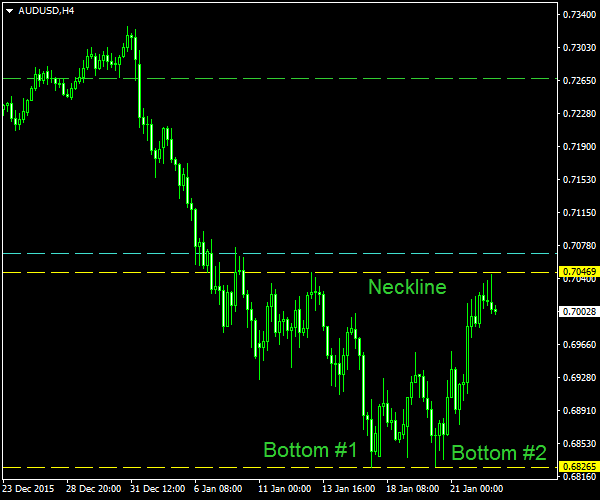
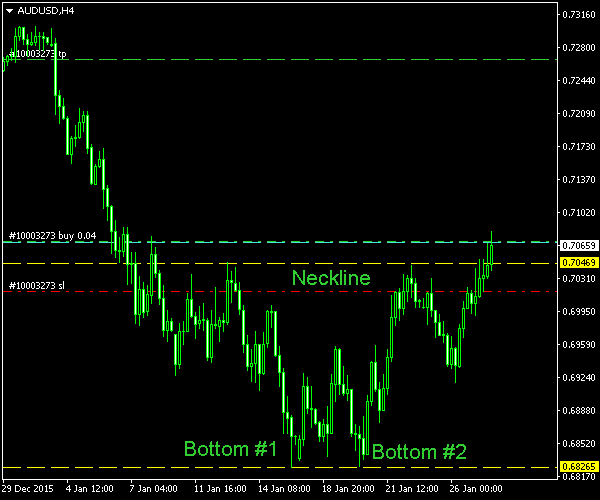
The yellow lines mark the neckline (upper) and the bottoms (lower). The cyan line is my potential breakout entry located at 10% of the pattern’s height (H) above the upper border. The green line is my potential take-profit level located at 100% of H above that same border. I will set my stop-loss to the low of the breakout bar or the low of the previous bar in case the breakout bar is positioned mostly above the border. I would not suggest trading a bearish breakout here until there is at least one more bounce from the lower border, confirming a horizontal channel pattern (rectangle). You can click on the image to see a full-size screenshot:

I have built this chart using the ChannelPattern script. You can download my MetaTrader 4 chart template for this AUD/USD pattern. You can trade it using my free Chart Pattern Helper EA.
Update 2016-01-27 18:04 GMT: I thought this one was going to be cancelled, but the breakout has finally occurred. The buy trade triggered at 16:34 GMT today at 0.70707. Stop-loss is set to 0.70166 and take-profit is at 0.72674. The breakout candle is not too strong, but the whole bullish wave looks promising:

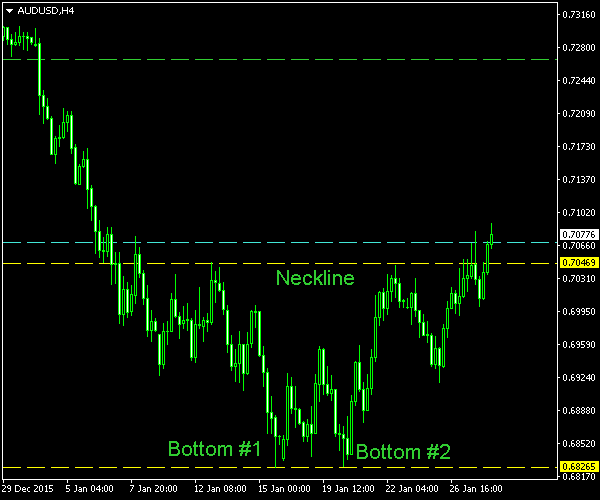
Update 2016-01-28: The stop-loss was hit at 20:01 GMT yesterday in a short-lived yet nasty pull-back:


If you have any questions or comments regarding this double bottom on AUD/USD chart, please feel free to submit them via the form below.

Leave a Reply

Your email address will not be published. Required fields are marked *

10 + = sixteen