
Market Profile indicator is a powerful tool developed by a CBOT trader. Its original purpose was to graphically organize price and time information obtained during a trading session in a manner useful to traders. Today’s Forex market is quite different from what commodity futures trading was back in 1985 when Peter Steidlmayer introduced his charting instrument to the public. Can Market Profile be a useful tool to Forex traders? In my opinion, it can.
Issues with Forex
The main difference in today’s currency market and the futures market of 80’s is the lack of daily trading sessions. Fortunately, it does not produce any real problem. The lack of strict daily close and daily open can be compensated by one of the following methods:
Apparently, it is still possible to apply Market Profile to modern foreign exchange market. The most consistent approach in our case seems to be the third one, which is based on weekly sessions.
Another important issue to solve when using this indicator in analysis is whether to apply it to the current session — and suffer from the lack of data during the early hours — or to the previous session, which could be based on stale data. In reality, this is no issue at all. As outlined in CBOT’s A
Moreover, it is possible (and useful) to look on several previous profiles at once, looking at how the trend developed across more than one value area.
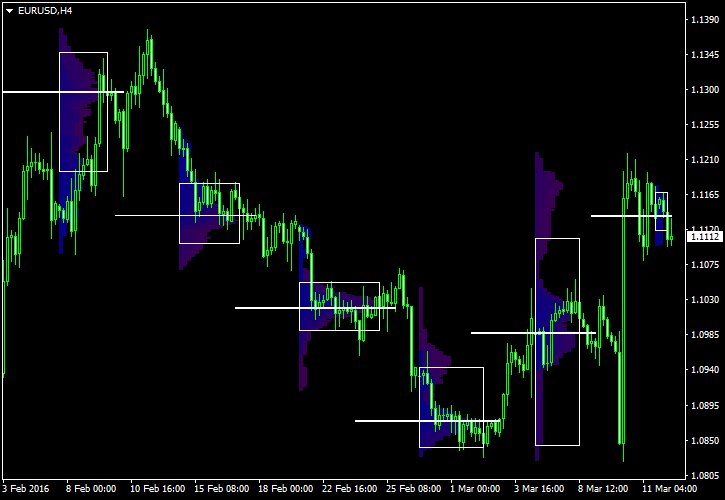
The following example shows Market Profile calculated for six weekly sessions of the EUR/USD currency pair:
Usage
As the indicator’s author stated, the Market Profile should not be used as a buy/sell signal generator. It is a tool for analyzing the market and getting information, which is not evident from the bare chart. Here is how the main parts of the Market Profiles can be used in Forex trading:
Value area — the area of market acceptance. The price spent a hefty amount of time at those levels — the market likes it. The edges of the value area form strong support and resistance levels.
Median — the middle of the value area offers a strong pivot point. It serves both as the attractor for the price and as the bounce level. The median is also called a fair price. If market is below the level, it is considered undervalued. If it is above the median, it is overvalued.
Areas of low volume — long tails below and above the value area show the price areas rejected by the market. Bottom tail is telling us of
I am not a regular user of Market Profile indicator. My main trading strategy is based on a different concept (chart patterns) while my other strategies are either automated with expert advisors or use fundamental indicators. Still, I do consult the
Your opinion
![]() Loading …
Loading …
If you want to share your opinion on what is the best way to use Market Profile in FX trading, please use the commentary form below.