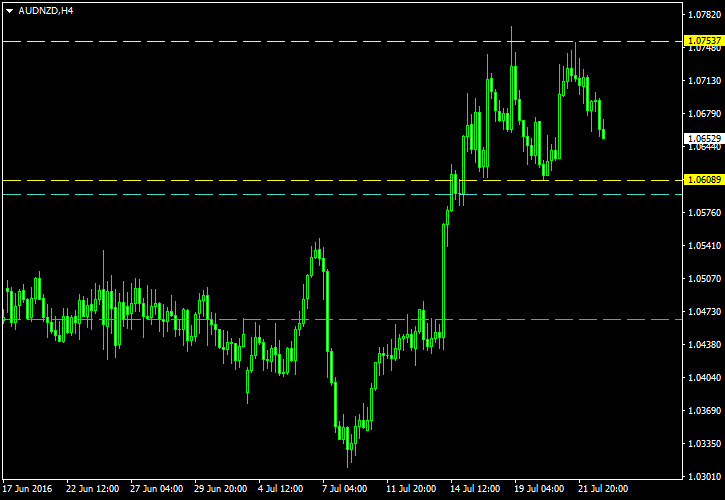
The Australian dollar had a rally going against the New Zealand dollar from July 8 through July 19. AUD/NZD has been consolidating in a kind of a double top pattern since then. The pattern is completed only when the right top’s slope reaches the neckline, but it is already time to set up a pending stop order in preparation for the breakout.
The chart below shows the double top pattern delimited with the yellow lines. The top one marks the tops, and the bottom one marks the neckline. The cyan line is my potential entry level in case of a bearish breakout. It is located at 10% of the pattern’s height below the neckline. The green line is my target — it is located at 100% of the pattern’s height below the neckline. I will set my

I have built this chart using the ChannelPattern script. You can download my MetaTrader 4 chart template for this AUD/NZD pattern. You can trade it using my free Chart Pattern Helper EA.
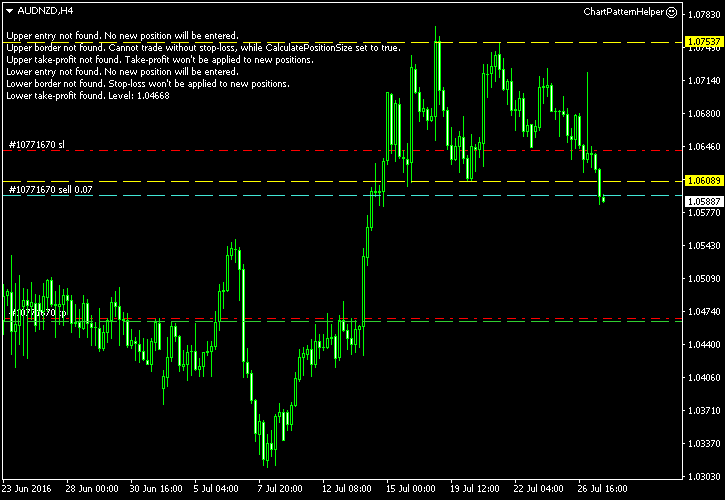
Update 2016-07-27 17:07 GMT: Short entry triggered at 1.05944 about 3 hours ago.
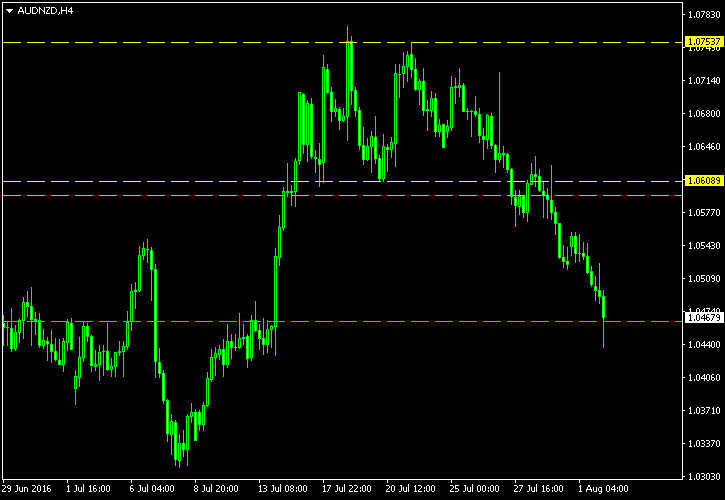
Update 2016-08-02 6:05 GMT: The breakout turned out to be a strong one even despite some pullback attempts. The
If you have any questions or comments regarding this double top on AUD/NZD chart, please feel free to submit them via the form below.