As per efficient market hypothesis, it is almost impossible to outperform the market. The reason is that marketâs efficiency ensures that relevant details of an asset are incorporated in the prevailing trading price. It means that, theoretically, there is no possibility of buying and selling an asset low and high respectively. Thus, a trader can outperform the market only through the purchase of riskier assets. However, practically, it is not always the case. There are instances where a currency remains undervalued or overvalued for a prolonged period of time. This contradiction can be explained only through the impact of traders’ sentiment on the market.
This article looks at the sentiment analysis, which is turning into a
Introduction to sentiment analysis
Contents
- 1 Introduction to sentiment analysis
-
2 Measuring sentiment analysis
- 2.1 Categorizing the mood of market participants
- 2.2 Determining the data sources
- 2.3 Data collector
- 2.4 Keyword list
- 2.5 Filtering
- 2.6 Individual score computation
- 2.7 Creating score map
- 2.8 Increasing accuracy
-
3 Sentiment analysis based on tradersâ orders
- 3.1 Spot and derivatives market
- 3.2 Legacy COT report
- 3.3 Calculating the open interest
- 3.4 Categories of traders as per COT report
- 3.5 Disaggregated COT report
- 3.6 Interpretation of COT report
-
4 Effectiveness of sentiment analysis
- 4.1 Effect of sentiment on volatility
- 4.2 Effect of sentiment on liquidity
- 4.3 Effect of sentiment on the price
- 4.4 Effect of COT report on the liquidity and volatility
- 5 Conclusion
A sentiment is purely a signal, indicating the probable direction of the price movement of an asset. The sentiment analysis or opinion mining is the process of assessing the undertone of a financial market by studying the most relevant and recent information about a particular asset or the market as a whole.
The sentiment analysis is done based on the behavioral assumption that some positive signals will lure more traders to buy the asset, thereby resulting in a rise in the price and
Measuring sentiment analysis
The price movement of an asset has a strong correlation with the market sentiment. This correlation can be analyzed. The sentiment can be assessed by selecting the relevant news or facts,
Categorizing the mood of market participants
The first step in the sentiment analysis is validating the mood of the market participants. Broadly speaking, a participant in Forex or any other financial market is prone to four different kinds of mood swings: happiness, sadness, calmness, and disappointment. In general, when the economic news that emerges out of some country turns out to be
Determining the data sources
To begin with, the Forex trader should first of all identify the proper data source for analysis. Usually, when performing the sentiment analysis using social signals, the analysts look at the following networking platforms:
Data collector
Analysts receive data from the sources through RSS feeds or similar methods. It is then stored in a database (e.g., XML file), which is also referred to as the collector.
Keyword list
The keywords enable further classification of the received news. While doing a sentiment analysis in the Forex market, the keywords can be the names of the currency pairs (EUR/USD, USD/CHF, GBP/JPY, etc.), an important economic event (nonfarm payroll, jobless claims, GDP, interest rate), or a political event (Brexit referendum for example). The keyword triggers a particular event data to be saved separately for further processing. In the case of a sentiment analysis for an equity market, the common keywords would be the name of the equity, ticker symbol, 12-month high/low, bonus, dividend, stock split, merger, acquisition, takeover bid, efficacy ratio, etc.
The keywords remain in the database and can be altered if necessary. Usually, as many as 5,000 keywords (D1) would be present in the data base. The above words can only draw the relevant data but cannot reflect the opinion of the crowd. To do so, specific words that can reflect the opinion of the market participants with respect to a Forex pair or any other asset being analyzed are used. The parsing algorithm takes care of that process as explained in the next section.
Filtering
The parsing algorithm removes the spaces, punctuation, emoticons, and all other commonly found syntax from the received data. Uncorrelated data, if any, is also removed by the filter.
In the database, there will be another set of words (D2) based on the established Profile of Mood States (POMS) questionnaire (psychometric). If necessary, more words can be added to it, depending on the nature of the asset being dealt with. The word list allows identification of the mood of an investor or speculator. For example, âwowâ, âbeatâ, âtopsâ, âexceedsâ, and âsurpassesâ indicate a happy or bullish mood. Once a match is found, the corresponding mood swing is allocated to that news. Furthermore, a score of â+1â is given to a positive mood swing, â-1â to a negative mood swing, and â0â to a neutral mood swing. The filter also ensures that data older than a
Individual score computation
On a given day, the number of positive, negative, and neutral instances for every keyword is calculated. By adding the positive, negative, and neutral values, the overall value of the mood swing for that keyword is found. In the same manner, the overall value of the mood swing for all the keywords pertaining to an asset being analyzed is calculated. Finally, the average score of all the keywords are calculated to arrive at the opinion of the market about the asset.
Let us assume that the sentiment analysis is done for the British pound. In this case, the data collector will receive the news from multiple sources discussed above and save it as an XML file. Using the keyword list (D1), all the data and related news pertaining to the pound will be retrieved. The POMS world list (D2) will then be matched with the retrieved data to identify the positive, negative, and neutral instance.
Let us assume that for a given keyword, the positive, negative and neutral instances are 5, 3, and 2 respectively. As mentioned earlier, for every positive and negative instance, a score of â+1â and â-1â respectively is provided. Similarly, a score of â0â is provided for a neutral instance. So, the score for the keyword would be +2 (5–3+0). In the same manner, the score for every keyword pertaining to that asset is calculated.
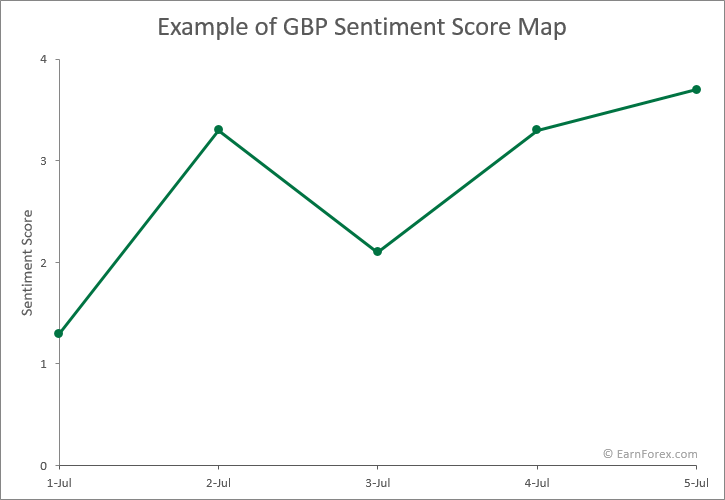
Again, for the ease of calculation, let us assume that the number of keywords is 3 and the score for each of the keyword is +2, +3, and -1. Now, the overall sentiment is calculated by calculating the average score of the keywords. The calculation results in a score of +1.3. This indicates that the sentiment is bullish with a slight positive score of 1.3.
Creating score map
In the example discussed above, the calculated score of +1.3 is for a single day. In the same manner, the scores are calculated on a daily basis and then plotted in a chart with dates on the

By looking at the graph, we can conclude the overall opinion of the market participants about the asset being studied. The above chart shows that the sentiment of the traders is becoming increasingly bullish. Values and dates are purely fictional and the chart is merely intended to demonstrate the analysis technique.
Identifying the overall sentiment is little easier when we are dealing with an equity, commodity, or index. In the case of currency pairs, the sentiment analysis should be done individually for both currencies and two score maps should be created. By comparing the score map of one currency with the other in the same chart, we can decide the overall traderâs sentiment towards the currency pair.
Increasing accuracy
By and large, the method discussed above is used by most of the data analysts with minor modifications. We have not gone into the details such as creating a program using MATLAB and improving the accuracy using multiple regression models. Finally, the accuracy is tested before using it for trading in the Forex market.
Sentiment analysis based on tradersâ orders
Professional traders know that
So, validating the long and short positions in the market would definitely give a clue about the prevailing marketâs sentiment towards the traded asset. However, it is not an easy task like calculating the
Before we understand the manner in which the data pertaining to the long and short positions are obtained, segregated, and finally interpreted, we shall look at some basic info related to the Forex market.
Spot and derivatives market
For more than 90% of the time, the term Forex market is used to refer the spot market where the bulk of currency exchange transactions take place on a daily basis. Most of the online Forex brokers offer a facility to trade in the spot market only. Furthermore,
Apart from the spot market, there exists the derivatives market, which includes the forwards, futures, and options. While forwards is an over the counter contract, usually between a bank and a client (for example, exporters who wish to protect from exchange conversion rate related losses), the futures and options are standardized
Similar to any other derivative contract, the forwards, futures, and options contracts have an expiry date and an order size. The expiry time period can vary between one month and six months or even more (near, next, and far contracts). The currency futures and options contracts trade on regulated exchanges such as the Chicago Mercantile Exchange (CME), Eurex, and ICE (Intercontinental exchange).
The
Legacy COT report
The derivative market is not a passive follower of the spot market. The reason is that large institutional players, through their own
There is no definite information regarding the
Calculating the open interest
The open interest reflects the position held by traders in the market. The COT report reflects the open interest for an asset in the derivatives exchange. In case of a currency, the open interest is calculated by summing up the total number of futures and option contracts which are still open and yet to be offset by a transaction or in any other manner (delivery, exercise, etc.). As it can be understood, the futures and options are different kinds of derivative products and directly summing up the long and short contracts does not make any sense. So, the only way to go about it is to convert the options contracts into equivalent futures contracts.
In case of COT, the traderâs positions in the options market are converted into a
For example, if the delta factor provided by the exchange is 0.50, then a trader holding 500 open option contracts will be considered as holding 250 futures (500×0.50) derivative contracts. Now, the
Categories of traders as per COT report
The COT report divides traders into three main groups:
Commercial and
A trader who uses futures contracts to hedge risk is categorized as a commercial trader. Usually, traders submit form 40 to disclose their trading intention to the CFTC. A trader who speculates in the market is categorized as a
Reportable and
Clearing members, futures commission merchants, and foreign brokers should compulsorily file daily report as long as their net positions are above specific levels stipulated by the CFTC. The levels are updated by the CFTC depending on the existing market conditions. In general, the reported positions would be between 70% and 90% of the total open interest in the market. The open interests of those traders who have insignificant volume (below the level prescribed by the CFTC) come under the
Disaggregated COT report
Beginning from 2009, CFTC started publishing the Disaggregated Commitment of Traders (Disaggregated COT) report along with the legacy COT report.
The Disaggregated COT report is another attempt by the CFTC to improve transparency. The report segregates the traders into four different categories:
The Disaggregated COT report is published along with the legacy COT report.
Producer/Merchant/Processor/User
Entities that handle commodities physically come under this category. Such enterprises use futures to hedge risks.
Swap dealers
Any organization which deals in swaps and uses the futures market to hedge risk comes under this category. The counter party to a swap dealer can be a speculative trader, hedge fund, or even a commercial trader. It should be noted that swaps are not exchange traded contracts. These
As of 2011, the financial institutions that dominated the swap market were:
According to the Bank for International Settlements (BIS), the notional value of swap contracts traded in 2012 was $642.1 trillion. The swap dealers have an association named International Swaps and Derivatives Association (ISDA). When the CFTC started publishing the Disaggregated COT report, the ISDA made several attempts to remove their transactions from the commercial tradersâ category. Such is the importance of the groupâs activity in the international financial markets.
Money managers
Individuals registered with the CFTC as a Commodity Trading Advisor (CTA) or Commodity Pool Operator (CPO).
Other reportables
Any other kind of trader who does not come under any of the categories mentioned above.
It should be noted that Disaggregated COT report is available only for the commodity markets. Currency, bond, and index traders will have to use the legacy COT report and/or Traders in Financial Futures (TFF) report.
Interpretation of COT report
A typical Disaggregated COT report for the crude oil is provided below:
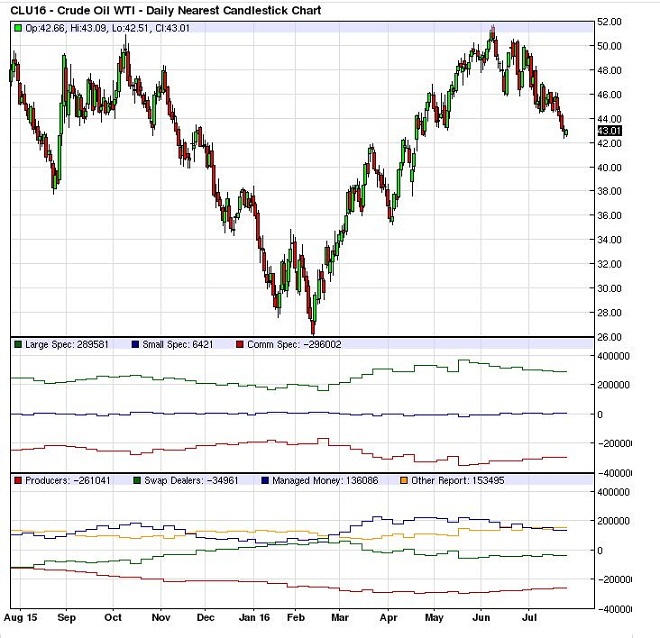
The
The chart reveals that as the net long positions of large speculators starts declining (October 2015 — February 2016), the crude oil continues to decline. Similarly, an increase in the net long positions of large speculators (
The
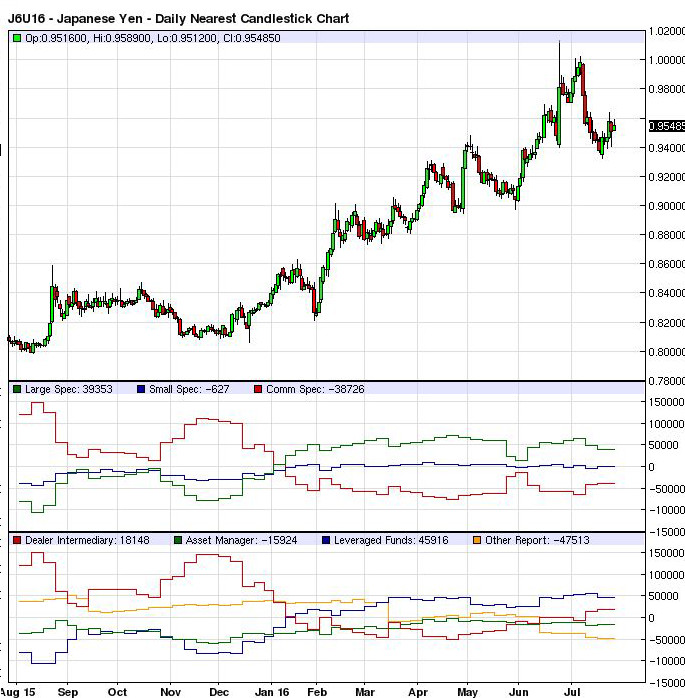
Now, let us study the legacy COT chart of the euro (EUR/USD):
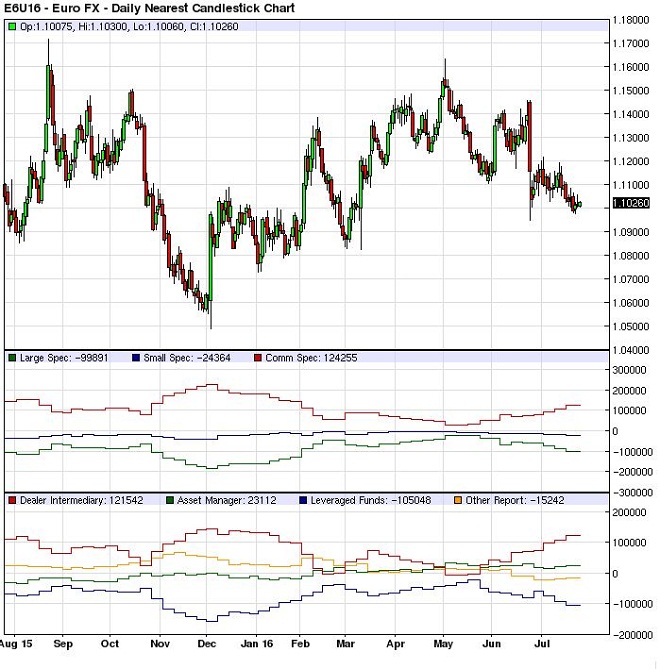
As discussed earlier, an increase in the net long position (December 2015 — May 2016) of the large speculators propels the exchange rate of the euro and vice versa.
In the same manner, an increase in the net long positions (December 2015 — June 2016) of leveraged funds turn the currency bullish and
By studying the net long and short positions of large speculators and swap dealers, a trader can interpret the existing sentiment in the commodity market. Similarly, by studying the net long and short positions of large speculators and leveraged funds, a trader can interpret the existing sentiment in the currency, bond, and indices market.
Several Forex brokers provide details regarding the long and short positions of traders on their website. This includes Oanda, Saxo Bank, and Dukascopy.
Effectiveness of sentiment analysis
Generally, a seasoned Forex trader or an equity investor gives due consideration to the following three characteristics of an asset, before making an investment decision. They are:
We can definitely say that the sentiment analysis is reliable as long as there is empirical proof of the impact of sentiment on the volatility and liquidity of an asset.
Effect of sentiment on volatility
The effect of sentiment on the Forex volatility was studied by Goddard, Arben Kita, and Qingwei Wang of Bangor Business School (UK) and University of Groningen (Netherlands). Since there is no single or dependable source to track the activity of retail traders, only the activities of large institutional traders were correlated with the change in the Google Search Volume Index (SVI) after giving due consideration to the macroeconomic fundamentals.
The Search Volume Index (SVI) is the ratio of worldwide search on specific keywords to the total number of searches in a given period. The resulting value is normalized and scaled between 0 and 100 for the ease of comparison. For the study, the data pertaining to seven major currency pairs (USD/JPY, GBP/USD, USD/AUD, EUR/USD, EUR/GBP, EUR/JPY, and GBP/JPY) was downloaded for the period from January 2004 to September 2011. The aggregate SVI data for a currency pair in both orders (USD/JPY and JPY/USD for example) was used during the study.
The implied volatility data for a currency pair was obtained from Bloomberg. A unit increase in the SVI was statistically found to increase the weekly trading volume by ¥500 trillion to ¥600 trillion in the USD/JPY pair. Thus, it can be argued that SVI is an acceptable data, based on which the effect of sentiment on the volatility can be studied.
The study clearly indicated that there exists a small positive correlation of 0.31 between the investorsâ sentiment and USD/JPY volatility. Still, the effect is statistically and economically significant. When SVI increased above the average, the volatility increased two to five times greater than what it was when the SVI was below the average. The research also showed that the SVI is related to the carry trade returns and the currency risk premium. The positive correlation increased to 0.75 when the overall Forex market volatility was taken into consideration instead of just the USD/JPY pair.
Examples
In Japan, the victory of Shinzo Abe in 2012 election resulted in a sharp decline of about 1,000 pips in the USD/JPY currency pair. Shinzo Abe was voted to power based on his promise to take the inflation to 2% through stimulus measures. Abeâs victory kindled the bearish sentiment on the Japanese yen, resulting in a sharp decline to the rate of 84.50 against the US dollar. The volatility increased merely out of bearish sentiment in this case.
The outcome of the series of surveys conducted before the Brexit voting tremendously impacted the sentiment on the Great Britain pound, thereby increasing the volatility. During those periods of high volatility, there were several positive economic data announcements emerging out of the UK. Unfortunately, the market discarded the info and moved in line with the sentiment created by the Brexit related surveys. Again, in this case, the volatility was driven by the sentiment rather than economic data.
The intensity of the crash in the US equity markets in 1987 was mainly due to the bearish sentiment that grew out of a series of negative economic news.
Effect of sentiment on liquidity
When volatility increases in a Forex market, the liquidity providers widen the spreads, thereby creating a cushion for the risk they bear. A research conducted by
In the case of an announcement, the market is usually well prepared to react. On the other hand, it takes time for the market to process the info and assess the pros and cons before reacting to news. During this period, the market participants will be generally unwilling to trade and this dries the liquidity temporarily. Such a behavior pattern was identified by the study conducted by PricewaterhouseCoopers. It may take anywhere between a few seconds to several days for the liquidity to return to normal. The 9/11 incident can be quoted as an example for this. The markets were shut down by regulators for several days, fearing an uncontrollable crash due to lack of liquidity. Thus, it can be understood that unexpected news would affect the overall sentiment and indirectly affect the liquidity in the market.
Examples
On January 15, 2015, the Swiss National Bank unexpectedly abandoned its 3-year policy of limiting the rise of the Swiss franc against the euro. The news caught the market by surprise. The spread widened by more than 50 pips. The franc appreciated by nearly 41% to hit a high of 0.8517 against the Euro. This is a classic example of bullish sentiment affecting the liquidity of a financial market. Once the market participants started taking rational decisions, the franc lost a portion of the gain to trade at about 1.0500 against the euro.
Likewise, the surprise outcome of the Brexit referendum saw the pound decline sharply against the major currencies. The bearish sentiment removed the liquidity from the market for a short span of time, thereby causing huge erosion in the exchange rate of the pound.
The bearish sentiment created by the 2008 credit crisis (bankruptcy filing by Lehman brothers, the acquisition of Merrill Lynch by Bank of America, and the rescue of AIG by the Federal Reserve) had a tremendous negative impact on the liquidity of the financial markets. This negative impact of bearish sentiment on the liquidity was studied in detail by Kurshid Ahmad (School of Computer Science and Statistics at Trinity College Dublin).
Effect of sentiment on the price
There are situations where even the slightest positive data would propel the market in a big manner. The strong uptrend would be attributed to the bullish sentiment prevailing in the market. The Fed’s discussion paper on the impact of macroeconomic announcements on real time Forex rates of emerging markets confirms this.
The Japanese yen is a classic example of the case discussed above. When the Bank of Japan made a surprise rate cut into the negative territory on January 29, 2016, the market reacted by pushing the yen to a low of 121.20 against the US dollar. However, the prevailing bullish sentiment (safe haven appeal of the yen) brought the USD/JPY currency pair back to levels near 117.00 in a matter of three days.
Effect of COT report on the liquidity and volatility
So far we discussed how the bearish or bullish sentiment created by the news, forums, and social media platforms triggers a change in the liquidity and volatility. Now, let us understand how the sentiment based on orders in the futures market affects the liquidity and volatility in the spot market.
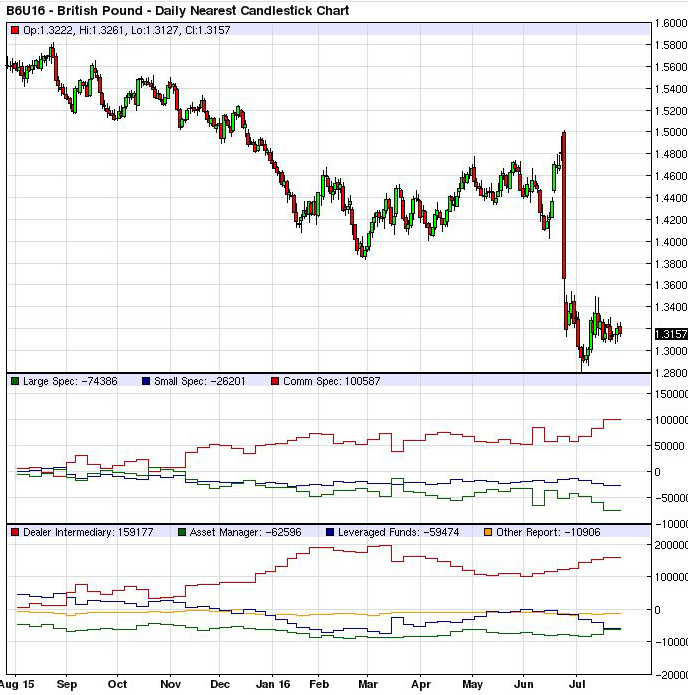
A comparison of the positions of large speculators in the futures market and the corresponding price movement in the spot market will reveal the impact of sentiment based on orders.
Between October 2015 and June 2016, the large speculators increased their net short positions in the pound.
Simultaneously, the large speculators increased their net long positions in the Japanese yen. The COT chart below reveals that quite clearly.
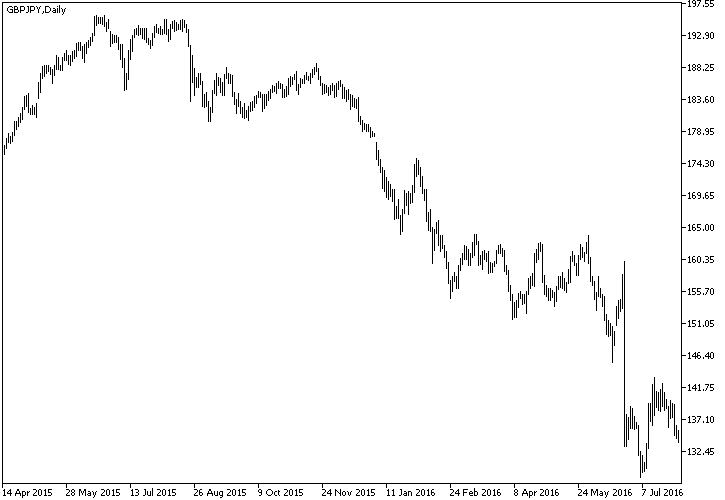
When large investors take opposite positions in two currencies, the corresponding currency pair would exhibit sharp a rise in volatility in the spot market. In this case, the GBP/JPY exhibited a steep decline as shown below.
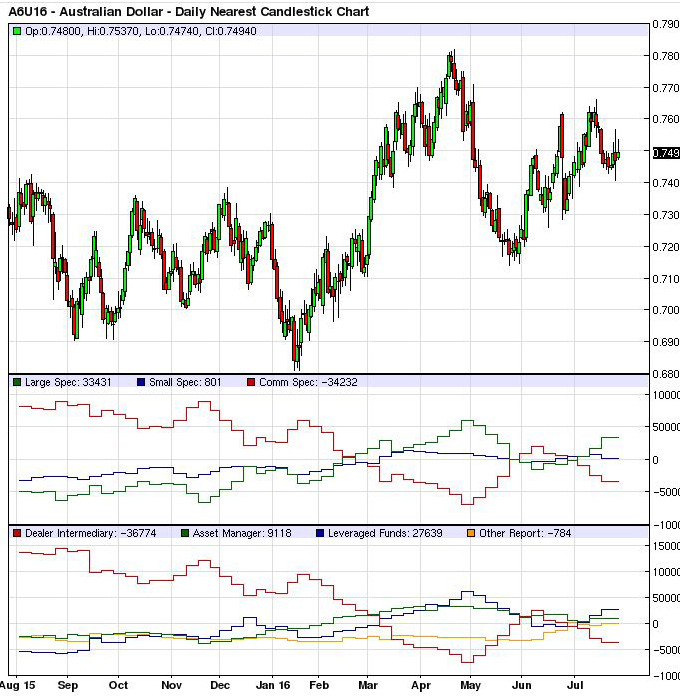
On the other hand, if the large speculators take a similar position in two currencies in the futures market, then the volatility will not be high in the corresponding currency pair. The COT chart for the Australian dollar can be seen below.
The COT chart for Japanese yen is repeated here:
The cumulative effect is demonstrated on the chart below:
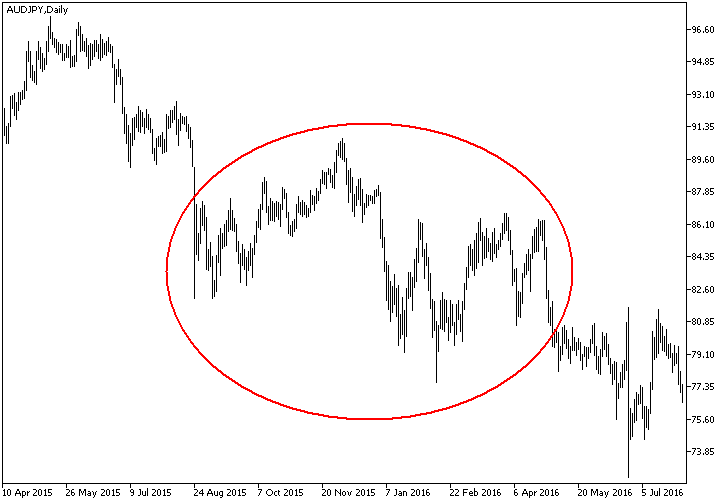
It can be noted that in the futures market, large speculators were bullish in both currencies. Furthermore, the large speculators have diluted their long positions once in a while in the Aussie. On the other hand, beginning from January 2016, the large speculators held almost the same amount of long contracts in the Japanese yen. This enabled the yen to turn mildly bullish against the Aussie in the spot market. Ultimately, this strengthened the JPY slightly against the AUD in the spot market. Still, the net volatility is relatively low when compared to the GBP/JPY pair. This shows that orders that flow in the futures market tend to create a bullish or bearish sentiment in the spot market and finally impact the volatility.
In the case of commodity markets, instead of studying the positions of large speculators or leveraged funds, a trader can look at the net long or short positions of swap dealers. Usually a swap dealer buys or sells an asset in the spot market and correspondingly opens an opposite trade in the futures market either to mitigate risk or to manage the future commitments. Thus, for every contract sold or bought in the futures market, a similar volume is traded in the spot market. Thus, any increase in the liquidity and volatility in the futures market will also result in a corresponding increase in the spot market. However, it should be remembered that swap dealers take mutually opposite positions in the spot and futures market. Thus, net positions and price trend would be inversely correlated.
Conclusion
From the above discussion, it can be understood that sentiment has a proven and credible impact on the financial markets. Time and again,
Do you have any experience in using sentiment analysis in Forex trading? How did it perform? What was the methodology of your analysis? Please share the details with us using the form below.