The Most Popular Fundamental Indicator?

Unarguably, the most popular technical indicator in Forex trading is moving average. The fundamental factors influencing the currencies are far more varied than the perceived technical forces (momentum, support and resistance, pivots). Moreover, traders assign different degrees of importance to different factors. Some prefer employment indicators, others watch changes in commodity price indices. Below, I attempt to summarize the wide range of fundamental indicators, providing brief explanation and examples for each of them. Near the end of the post, you can vote for the top three indicators you use in fundamental analysis.

Contents

  • 1 Automotive Industry
  • 2 Commodity Indicators
  • 3 CPI (Inflation)
  • 4 Current Account
  • 5 Employment
  • 6 GDP (Gross Domestic Product)
  • 7 Interest Rates
  • 8 Real Estate Market
  • 9 Sentiment Indices
  • 10 Stock Market Performance
  • vote

Automotive Industry
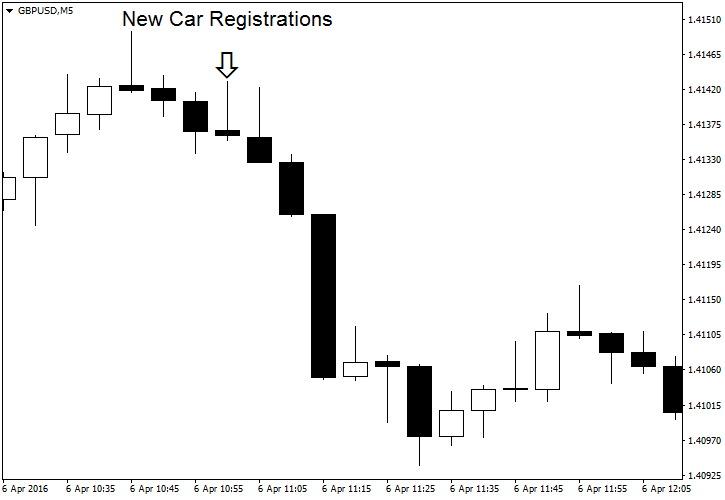
Automotive industry plays a huge role in economy. First, it provides employment to thousands of people. Second, it creates demand for commodities and products of other industries. Finally, the demand for automobiles indicates the willingness of population to spend money on durable goods. In this sense, any car sales index helps traders to assess the state of the economy using an indirect but timely reported measure. It takes one month to get the preliminary GDP report for the previous quarter whereas vehicle sales data for the previous month is normally available in the beginning of the next month. The big problem with such industry reports is that there is a number of reasons for the sales number to fluctuate, and not all of them are of economic nature — for example, cars coming into or out of fashion. Moreover, car industry’s role decreases each year as the developed nation advances further from the manufacturing based economy.
You can see the pre-Brexit effect of the UK New Car Registrations report on GBP/USD currency pair:

The following monthly reports demonstrate examples of the auto industry fundamental indicators followed by FX traders:
United States

  • US Market Light Vehicle Deliveries reported by the Autodata Corporation
  • Eurozone

  • Monthly Provisional Passenger Car Registrations reported by the European Automobile Manufacturers’ Association.
  • United Kingdom

  • UK New Car Registrations reported by the Society of Motor Manufacturers and Traders
  • Japan

  • Motor Vehicle Production and New Registrations-Sales data reported by Japan Automobile Manufacturers Association Inc.
  • Australia

  • Sales of New Motor Vehicles in Australia reported by the Australian Bureau of Statistics
  • New Zealand

  • Vehicle Sales reported by the Motor Industry Association Inc.
  • Switzerland

  • New registrations of road vehicles reported by the Swiss Federal Statistical Office.
  • Canada

  • New motor vehicle sales reported by Statistics Canada.
  • Commodity Indicators
    Commodity indicators come in different flavors: futures prices, compiled price indices, inventories reports, production estimates, supply and demand forecasts, etc. With some notable exceptions, the modern developed nations’ economies hardly depend on commodity prices except for the crude oil. However, exports of particular commodities play a significant part in some countries’ exports: New Zealand relies on its dairy farming, South Africa exports gold, platinum, and iron ore, and Canada is known for its oil industry.
    Normally, higher exports commodity output and prices are good for the country’s currency because it tends to promote economic growth. At the same time, lower energy commodities prices are good to all importing countries as they make production and living cheaper, freeing disposable income. Disruption in commodity production in one part of the world could be a boon to a country exporting the same commodity in the other part of the world due to a perceived price surge.
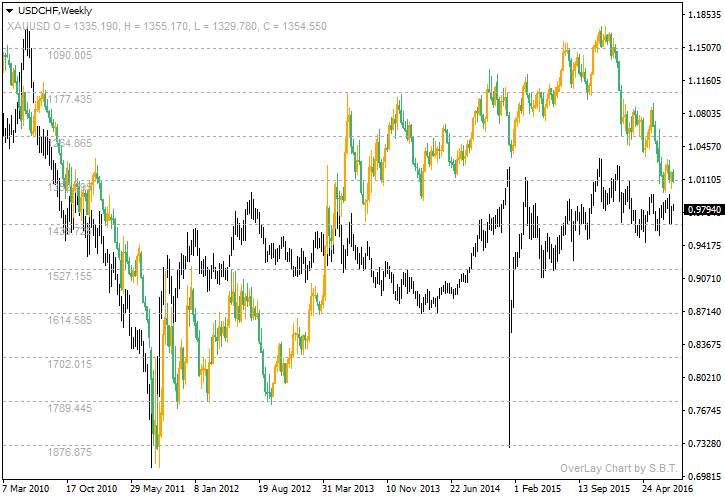
    Gold price dynamics is important to most of the currency traders due to its indication of the market’s general risk aversion or risk hunger — gold tends to rise during the times of low tolerance for risk and fall during the periods when investors are willing to hold risky assets. However, in recent times, gold can exhibit a different behavior pattern — falling and rising depending on availability of safe options with high yields (currencies with high interest rates or bullish stock markets).
    See the USD/CHF pair’s correlation with spot Gold rate. Gold uses inverted scale (left) and is shown in green/orange candles. USD/CHF uses normal scale (right) and is shown in black:

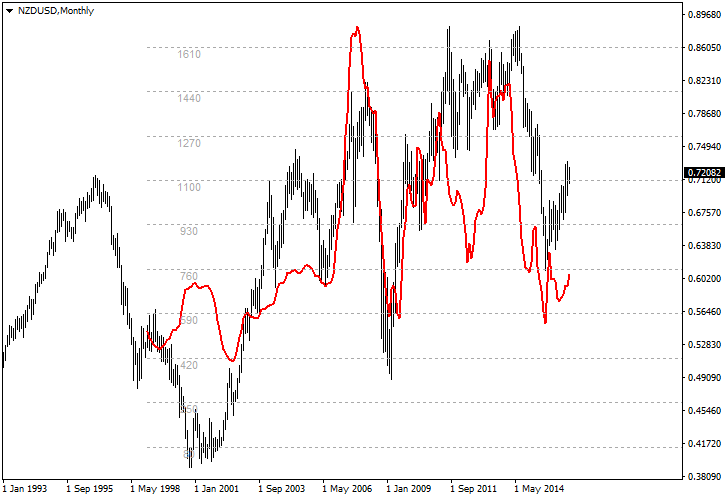
    Notable correlation can be seen on this NZD/USD monthly chart with overlay of GDT Price Index (dairy prices). NZD/USD is in black, GDT is in red:

    Here is the list of indicators based on commodity markets and followed by FX traders:
    United States

  • Weekly Petroleum Status Report and Weekly Natural Gas Storage Report from the US Energy Information Administration.
  • Weekly Oil Rig Count reports from Baker Hughes.
  • Australia

  • Monthly Index of Commodity Prices reported by the Reserve Bank of Australia.
  • New Zealand

  • Global Dairy Trade Event Results released semimonthly by GlobalDairyTrade Holdings Limited in New Zealand.
  • Monthly ANZ Commodity Price Index reported by the ANZ Bank New Zealand Limited.
  • Other

  • Quarterly Gold Demand Trends reported by the World Gold Council.
  • Commodity prices data feeds.
  • CPI (Inflation)
    CPI (or inflation in general) is an important fundamental indicator because it directly affects every central bank’s monetary policy. Central banks are mandated to promote moderate price growth (at about 2% per year), so higher inflation normally means higher interest rates, which will attract buyers and send the currency growing. In reality, it works that way only with developed nations with low or moderate inflation. Countries with historically elevated inflation rates do not get their currency appreciating via higher price index values.
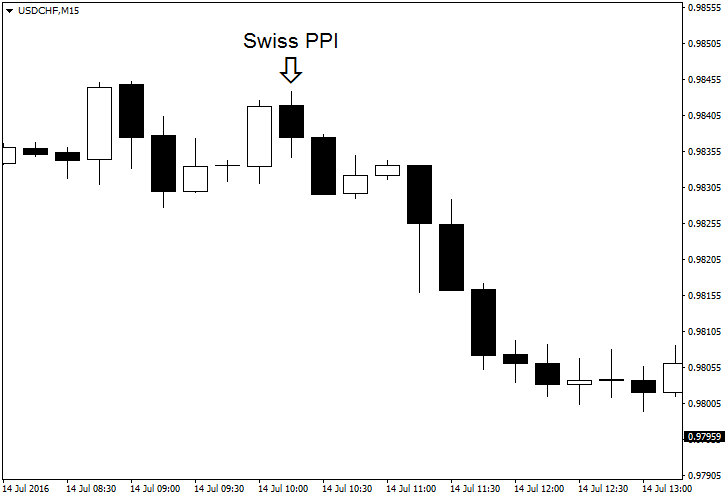
    Price indices come in two general varieties: consumer and producer. While central banks are interested mostly in consumer price inflation, producer price inflation is a helpful tool in assessing potential increases or decreases in the former.
    On the chart below, you can see how better-than-expected PPI report from Switzerland affected USD/CHF rate in July this year:

    Here is the list of inflation reports for the major currencies (monthly unless stated otherwise).
    United States

  • Consumer Price Indexes and Producer Price Indexes reported by the US Bureau of Labor Statistics.
  • Personal consumption expenditures (PCE) reported by the US Bureau of Economic Analysis.
  • Eurozone

  • Harmonized Index of Consumer Prices (HICP) and Industrial producer price index reported by Eurostat.
  • United Kingdom

  • UK producer price inflation and consumer prices index reported by the Office for National Statistics.
  • Japan

  • Consumer price index reported by Statistics Bureau of Japan.
  • Services Producer Price Index (SPPI) and Corporate Goods Price Index (CGPI) reported by the Bank of Japan.
  • Australia

  • Consumer Price Index and Producer Price Indexes are reported by the Australian Bureau of Statistics quarterly.
  • Melbourne Institute Monthly Inflation Gauge is offered by the University of Melbourne on paid basis.
  • New Zealand

  • Consumers Price Index and Business Price Indexes reported by the Statistics New Zealand.
  • Switzerland

  • Consumer Price Index and Producer Price Index reported by the Federal Statistical Office.
  • Canada

  • Consumer Price Index reported by the Bank of Canada.
  • Industrial product price indexes reported by Statistics Canada.
  • Current Account
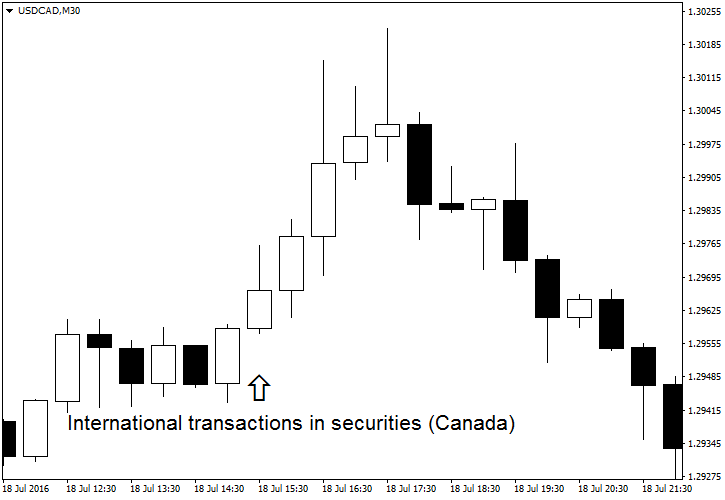
    Current account is actually an umbrella term for two major indicators: trade balance and net foreign purchases of the country’s long-term securities. Positive trade balance means a higher demand for the currency. Negative trade balance means lower demand for the currency. At the same time, appreciating currency leads to deterioration of the trade balance as the exports become more expensive and less competitive while imports become cheaper. Net purchases of the country’s bonds and other long-term securities indicate higher demand, while net sales indicate lower demand for currency.
    You can see a demonstration of current account’s effect on the Forex market on this chart. It shows how a poor International transactions in securities report from Canada affected USD/CAD in July 2016:

    Current account indicators for the major currencies include the following list.
    United States

  • US International Trade in Goods and Services reported monthly by the US Bureau of Economic Analysis.
  • Treasury International Capital (TIC) data released monthly by the US Department of the Treasury.
  • US International Transactions released quarterly by the Bureau of Economic Analysis.
  • Foreign Trade reported monthly by the US Census Bureau.
  • Eurozone

  • Euro area balance of payments reported monthly by the European Central Bank.
  • International trade reported by Eurostat.
  • United Kingdom

  • UK trade and Public sector finances reported monthly by the Office for National Statistics.
  • Balance of Payments reported quarterly by the Office for National Statistics.
  • Japan

  • Trade Balance and Balance of Payments reported monthly by the Ministry of Finance.
  • Australia

  • Balance of Payments and International Investment Position and International Trade in Goods and Services reported by the Australian Bureau of Statistics.
  • New Zealand

  • Overseas Merchandise Trade and Balance of Payments and International Investment Position reported by the Statistics New Zealand.
  • Switzerland

  • Monthly trade balance reported by the Federal Statistical Office.
  • Canada

  • International transactions in securities, international merchandise trade, and balance of international payments reported by Statistics Canada.
  • Employment
    Employment is an important economic factor. Rising employment implies rising consumer spending power and indicates that businesses are expanding via job creation. Upholding maximum employment is a crucial part of the Federal Reserve’s mandate. Others (like the Reserve Bank of Australia or the Bank of England) mention promoting the employment as one of the objectives of their monetary policy. Thus, improving employment benefits the currency in two ways — by indicating stronger economic growth and by allowing the central bank to keep interest rates at a higher level.
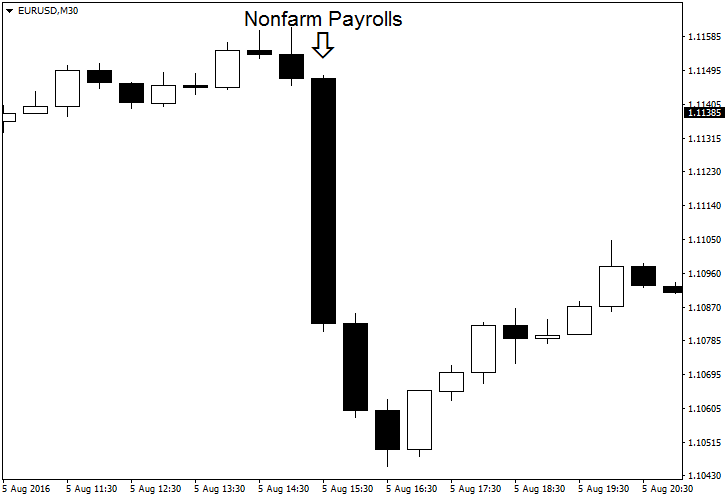
    This positive Nonfarm Payroll Employment report released in the USA on August 5, 2016, shows how powerful jobs data can be in Forex:

    Notable employment reports watched by Forex market participants are listed below.
    United States

  • Nonfarm payroll employment and Job Openings and Labor Turnover Survey reported every month by the US Bureau of Labor Statistics.
  • Unemployment insurance weekly claim reports by the US Department of Labor.
  • Monthly ADP Employment Reports by ADP Research Institute.
  • Monthly Job Cut Report by Challenger, Gray & Christmas.
  • Eurozone

  • Employment and unemployment quarterly data by Eurostat.
  • Unemployment rate reported monthly by Eurostat.
  • Employment accounts reported by Statistisches Bundesamt.
  • United Kingdom

  • UK Labour Market Statistical bulletins released monthly by the Office for National Statistics.
  • Japan

  • Labour Force Survey reported monthly by the Statistics Bureau.
  • Australia

  • Labour Force monthly reports by the Australian Bureau of Statistics.
  • New Zealand

  • ANZ Australian job advertisements reported by Australia and New Zealand Banking Group Limited.
  • Switzerland

  • Unemployment Rate reported by the State Secretariat for Economic Affairs.
  • Canada

  • Labour Force Survey reports by Statistics Canada.
  • GDP (Gross Domestic Product)
    GDP (Gross domestic product) is the single universally accepted measure of the economic output. It is a broad measure that tries to encompass as much data as practically possible and it has its disadvantages. However, it is one of the strongest factors that affect the Forex rates — and not only upon the GDP value announcements, but also as the estimates and forecasts of the indicator change. Actual GDP is reported quarterly but, for example, in the USA, we get 3 reports per quarter — advance, preliminary, and final estimates for the quarter. Also, some other fundamental monthly reports serve as an intermediate for GDP growth assessment: industrial production, retail sales, business inventories, manufacturing sales, durable goods orders, etc.
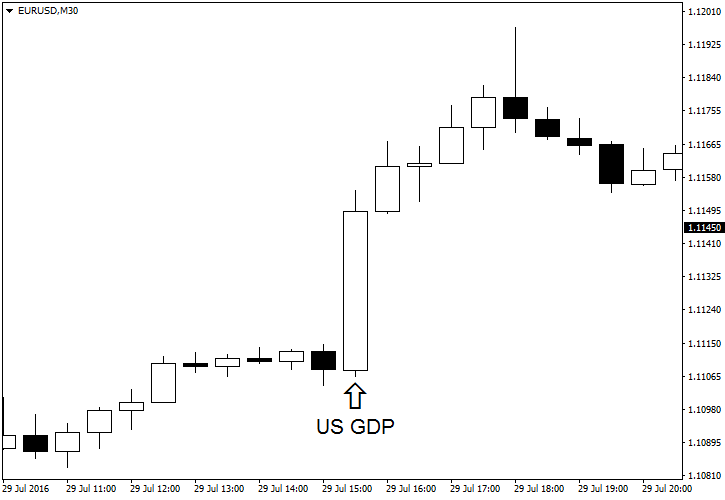
    You can see how dismal GDP report from the United States sends EUR/USD up in late July this year:

    Below is the list of economic growth related reports for the major currencies.
    United States

  • Gross Domestic Product by the US Bureau of Economic Analysis.
  • Monthly Industrial Production and Capacity Utilization report by the Federal Reserve.
  • Advance Monthly Retail Trade Report, Manufacturing & Trade Inventories & Sales, Manufacturers’ Shipments, Inventories, & Orders, and Monthly & Annual Wholesale Trade reports by the US Census Bureau.
  • Eurozone

  • GDP Tables, Statistics on the production of manufactured goods database, and monthly retail trade reports by Eurostat.
  • Country-specific reports from the eurozone.
  • United Kingdom

  • Quarterly National Accounts, UK index of production, and Retail sales in Great Britain statistical bulletins by the Office for National Statistics.
  • Japan

  • Current Survey of Commerce, Indices of Industrial Production, and Indices of All Industry Activity by the Ministry of Economy, Trade and Industry.
  • Machinery Orders report by the Economic and Social Research Institute of the Cabinet Office in the Government of Japan.
  • Australia

  • Australian National Accounts: National Income, Expenditure and Product, Private New Capital Expenditure and Expected Expenditure, and Business Indicators reported quarterly by the Australian Bureau of Statistics.
  • Retail Trade reported monthly by the Australian Bureau of Statistics.
  • New Zealand

  • Gross Domestic Product and Economic Survey of Manufacturing by the Statistics New Zealand.
  • Switzerland

  • GDP quarterly estimates and monthly Retail trade reports by the Federal Statistical Office.
  • Canada

  • Gross domestic product by industry (monthly), Monthly Survey of Manufacturing, Wholesale trade, and Retail trade reported by Statistics Canada.
  • Interest Rates
    Interest rates are the unique fundamental indicator in that they also add real value to the traded currencies. While holding gold or some other tangible investment normally incurs storage costs, holding cash in a high interest rate currency results in passive gain. Central banks control the reference interest rate, which affects all other interest rates associated with currency. Although brokers apply rollover interest spreads to the swap rates paid and charged on your retail trading positions, your overnight interest rate is also based on the one set by the central banks.
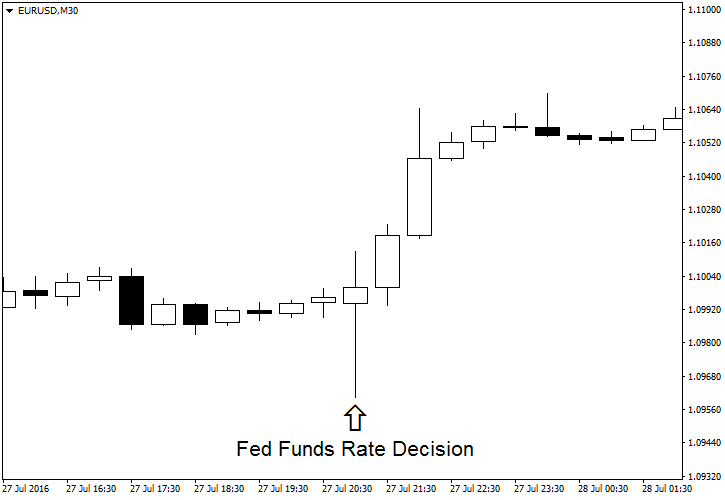
    FOMC’s July 2016 decision to keep interest rates unchanged in the USA was not anything unexpected, but the hints of less rate increases in the near future sent the EUR/USD rate rallying:

    Below you will find the list of the major central banks’ pages providing information on their main interest rates.
    United States

  • Open Market Operations by the Federal Reserve.
  • Eurozone

  • Governing Council decisions by the European Central Bank.
  • United Kingdom

  • Monetary Policy Committee Decisions, Minutes and Forecasts by the Bank of England.
  • Japan

  • Monetary Policy Releases by the Bank of Japan.
  • Australia

  • Cash Rate by the Reserve Bank of Australia.
  • New Zealand

  • Official Cash Rate (OCR) decisions and current rate by the Reserve Bank of New Zealand.
  • Switzerland

  • Current interest rates and exchange rates by the Swiss National Bank.
  • Canada

  • Key Interest Rate by the Bank of Canada.
  • Real Estate Market
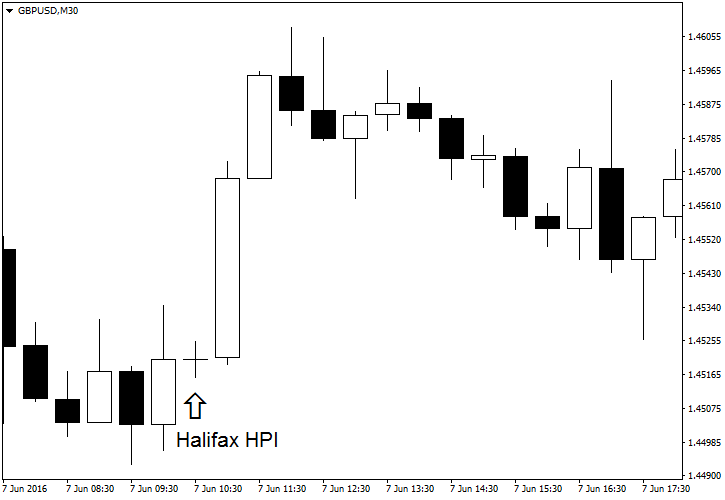
    Real estate market provides a number of indicators for the currency traders to assess the state of the country’s economy and desirability of its currency to foreign investors. Healthy and growing housing market demonstrates normal economic development and provides incentives to domestic investors, which results in construction job creation and increased demand for infrastructure commodities. At the same time, rising house prices attract foreign investors, providing additional demand for the domestic currency. It should be noted, that a hot real estate market may quickly turn from boon to bane if the asset bubble forms and bursts uncontrollably.
    On the example chart below, you can see how a positive House Price Index report from British Halifax helped the pound vs. the US dollar on June 7 this year:

    The list of housing market indicators affecting the major currencies is provided below:
    United States

  • Value of Construction Put in Place Survey, New Residential Construction, and New Residential Sales by the US Census Bureau.
  • US House Price Index reported by the Federal Housing Finance Agency.
  • Pending Home Sales and 
    Existing-Home Sales by the National Association of Realtors.
  • The S&P CoreLogic Case-Shiller 20-City Composite Home Price NSA Index by S&P Dow Jones Indices LLC.
  • Eurozone

  • Short-term business statistics (includes Construction, building, and civil engineering data) from Eurostat.

  • United Kingdom

  • RICS House Price Balance by the Royal Institution of Chartered Surveyors.
  • Output in the Construction Industry reported by the Office for National Statistics.
  • House Price Index by Rightmove Group Ltd.
  • Halifax House Price Index by Halifax UK.
  • House Price Index by Nationwide Building Society.
  • UK House Price Index reported by the UK Government.
  • BBA High Street Banking statistics by the British Bankers’ Association.
  • Approvals for lending secured on dwellings reported by the Bank of England.
  • Japan

  • Current Survey on Construction Statistics by the Ministry of Land, Infrastructure, Transport and Tourism of the Government of Japan.
  • Australia

  • New Home Sales by the Housing Industry Association Limited of Australia.
  • Housing Finance, Building Approvals, Construction Work Done, and Residential Property Price Indexes reported by the Australian Bureau of Statistics.
  • New Zealand

  • Reports on Building Consents Issued by the Statistics New Zealand.
  • Switzerland

  • Switzerland Real Estate — Single Family Homes quarterly index by Bloomberg.
  • Canada

  • Housing Starts by Canada Mortgage and Housing Corporation.
  • Building permits and New Housing Price Index reported by Statistics Canada.
  • Sentiment Indices
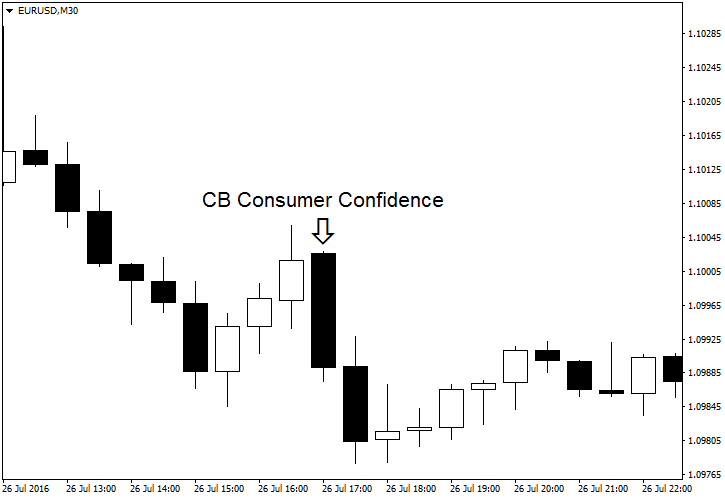
    Sentiment indices is probably the widest group of fundamental indicators. They can be divided into three categories: manufacturing, services, and consumer. Neither of three offer objective picture of the economic situation, but rather try to present an intersubjective view. The advantage of the sentiment survey indicators is that they help traders to assess the strength or weakness of the particular sector of the economy in advance. Such indicators are usually reported twice per month — first, preliminary values and then, the final ones. This results in a leading fundamental indicator. Higher confidence readings suggest expansion, while lower readings suggest contraction. Currencies tend to rise on optimistic reports and fall on those below expectations. Smart traders also learn to use sentiment indicators to forecast other macroeconomic statistics.
    You can see how sentiment indicators affect the currency market with this Consumer Confidence example. A better-than-expected report from the US Conference Board pulled EUR/USD down on July 26:

    The sentiment index industry is dominated by Markit, but there are other noteworthy reports in this field too. Below is the list of the most important sentiment indicators for the major currencies:
    United States

  • Consumer Confidence Survey by the Conference Board Inc.
  • Surveys of Consumers by the University of Michigan.
  • Manufacturing, services, and composite PMI by Markit.
  • Manufacturing ISM Report On Business and Non-Manufacturing ISM Report On Business by Institute for Supply Management.
  • Fifth District Survey of Manufacturing Activity by the Federal Reserve Bank of Richmond.
  • Chicago Business Barometer by the Institute for Supply Management.
  • Manufacturing Business Outlook Survey by the Federal Reserve Bank of Philadelphia.
  • Empire State Manufacturing Survey by the Federal Reserve Bank of New York.
  • Small Business Economic Trends by the US National Federation of Independent Business.
  • Eurozone

  • ZEW Indicator of Economic Sentiment by the Centre for European Economic Research (ZEW).
  • Business and Consumer Surveys by Eurostat.
  • Ifo Business Climate Index by the CESifo Group.
  • Manufacturing, services, and composite PMI by Markit.
  • Economic Survey by sentix.
  • United Kingdom

  • Consumer Confidence by GfK.
  • Manufacturing, services, and composite PMI by Markit.
  • Industrial Order Expectations and Realized Sales reported by the Confederation of British Industry.
  • Japan

  • Tankan Manufacturing Index and Non-Manufacturing Index reported by the Bank of Japan.
  • Consumer Confidence Survey and Economy Watchers Survey by the Economic and Social Research Institute of the Cabinet Office in the Government of Japan.
  • Manufacturing, services, and composite PMI by Markit.
  • Australia

  • NAB Monthly Business Survey and NAB Quarterly Business Confidence by National Australia Bank Limited.
  • Consumer Sentiment by Westpac Banking Corporation.
  • Manufacturing, Services, and Construction Indices by the Australian Industry Group.
  • New Zealand

  • Business Outlook Survey by ANZ Bank New Zealand Limited.
  • NZIER Quarterly Survey of Business Opinion by the New Zealand Institute of Economic Research (Inc).
  • Performance of Manufacturing Index by BusinessNZ.
  • Survey of expectations by the Reserve Bank of New Zealand.
  • Switzerland

  • Consumer Confidence Survey by the State Secretariat for Economic Affairs.
  • ZEW-CS Indicator for the economic sentiment by the Centre for European Economic Research (ZEW).

  • Manufacturing PMI by procure.ch.
  • Canada

  • Business Outlook Survey by the Bank of Canada.
  • Ivey Purchasing Managers Index by the Ivey Business School.
  • Manufacturing, services, and composite PMI by Markit.
  • Stock Market Performance
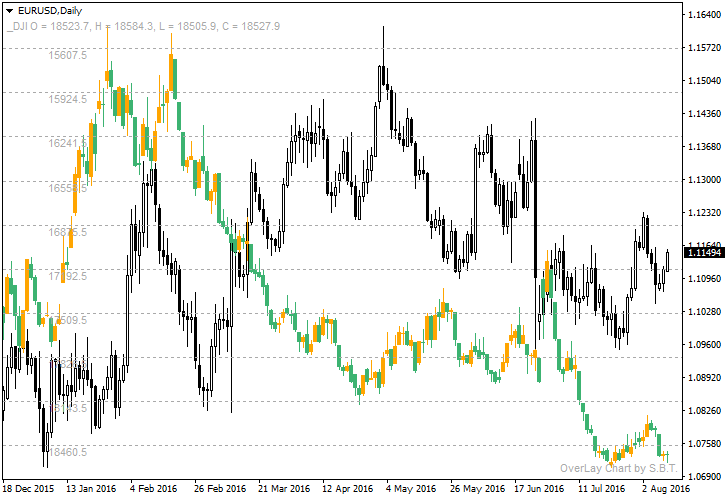
    Stock market performance is somewhat similar in its effect to the commodity prices mentioned earlier. Stock prices rally when traders and investors are full of optimism towards the country’s economy. Under normal conditions, stock indices’ growth results in the domestic currency rallies. However, there are feedback loops that make things quite complicated. First, the equities tend to rise as the country’s interest rate falls (including when expectations of the future interest rate value are lowered), which is a bearish factor for the currencies. Second, rising stock prices may be a signal of a higher tolerance for risk, which can poorly affect the risk-haven currencies (such as USD, JPY, and CHF). All in all, the stock market performance is seen as a correlated indicator for the related currency, but extra caution has to be applied when relying on it.
    The correlation chart of EUR/USD and the Dow Jones Industrial Average index is shown below. DJI uses inverted scale (left) and is shown in green/orange candles. EUR/USD uses normal scale (right) and is shown in black and white:

    The list of the main stock market indices relevant to major currencies are listed below.
    United States

  • S&P 500 Index
  • Dow Jones Industrial Average
  • NASDAQ-100
  • Eurozone

  • Euro Stoxx 50
  • DAX
  • CAC 40
  • FTSE MIB
  • IBEX 35
  • United Kingdom

  • FTSE 100 Index
  • Japan

  • Nikkei 225
  • TOPIX
  • Australia

  • S&P/ASX 200
  • New Zealand

  • NZX 50 Index
  • Switzerland

  • Swiss Market Index
  • Canada

  • S&P/TSX Composite Index
  • Poll
    I believe that in the foreign exchange market, the indisputable king of fundamental factors is the central banks’ interest rates. They are followed by GDP and CPI. And how about you?

    What are the three most important fundamental indicators in Forex?

    View Results

     Loading …

    If you want to share your thoughts on using the fundamental indicators in Forex trading, please feel free to reply using the commentary form below.

    Leave a Reply

    Your email address will not be published. Required fields are marked *

    + sixty two = sixty eight