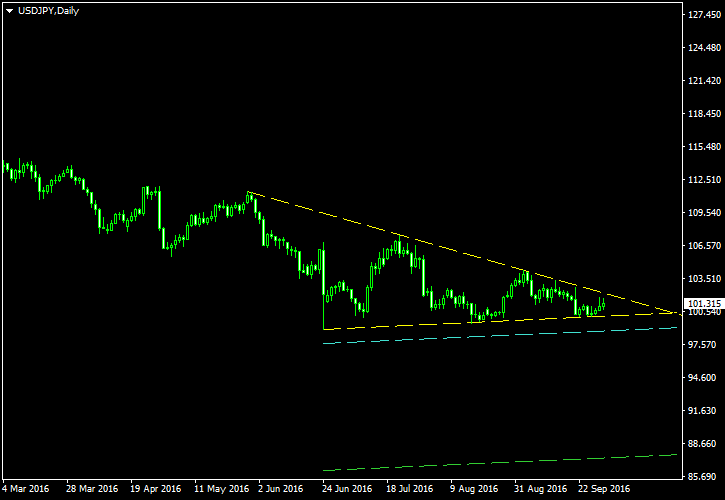
It was not easy to decide whether it should be called a descending triangle or a symmetrical one. In reality, it is something in between, but the descending triangle looks to be a more appropriate designation for this USD/JPY pattern because the lower border’s slope is significantly less pronounced than the upper one’s. The formation serves as a
The yellow borders mark the triangle pattern itself. The cyan line is my potential entry level constructed at 10% of the triangle’s base width below the lower border. The green line is my potential exit level (yeah, the yen at 87.xx indeed seem

I have built this chart using the ChannelPattern script. You can download my MetaTrader 4 chart template for this USD/JPY pattern. You can trade it using my free Chart Pattern Helper EA.
Update 2016-10-04 18:30 GMT: I have just cancelled the trade setup for this triangle because the pattern is obviously no longer valid:

If you have any questions or comments regarding this descending triangle on USD/JPY chart, please feel free to submit them via the form below.