
The chart pattern we can now observe on the weekly chart of the USD/JPY currency pair is obviously a triangle. It is formed by the FX rate consolidating in a narrowing range, which follows a strong downtrend that persisted in the dollar/yen pair since June 2015 and set its lowest low in June 2016. The triangle is not strictly symmetrical, with the lower border being more horizontal than the upper one. Yet it offers a valid bearish breakout opportunity to
The pattern itself is marked with the yellow lines on the chart below. The cyan line marks my pending entry level for a breakout trade. I have placed it at 10% of the triangle’s width (measured at the base) below the lower border. The green line marks my
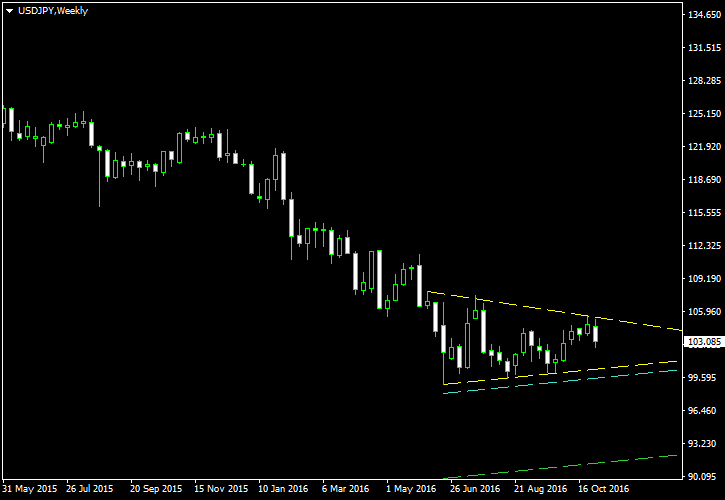
I have built this chart using the ChannelPattern script. You can download my MetaTrader 4 chart template for this USD/JPY pattern. You can trade it using my free Chart Pattern Helper EA.
Update 2016-11-16: I have cancelled this trade setup due to the upper border breakout:

If you have any questions or comments regarding this symmetrical triangle on USD/JPY chart, please feel free to submit them via the form below.