
NZD/USD is still rising inside an ascending channel that has began forming in August of 2015. This channel follows a major downward wave that had brought the currency pair down by 30%. The formation may serve as a continuation pattern with a breakout signaling a good shorting opportunity in New Zealand dollar.
The channel itself is marked with the yellow lines on the chart screenshot below. The cyan line will serve as my entry level. It is positioned at 10% of the channel’s width below the lower border. The green line is to serve as my target level if breakout occurs. It is placed at 100% of the channel’s width below the border. I will set my
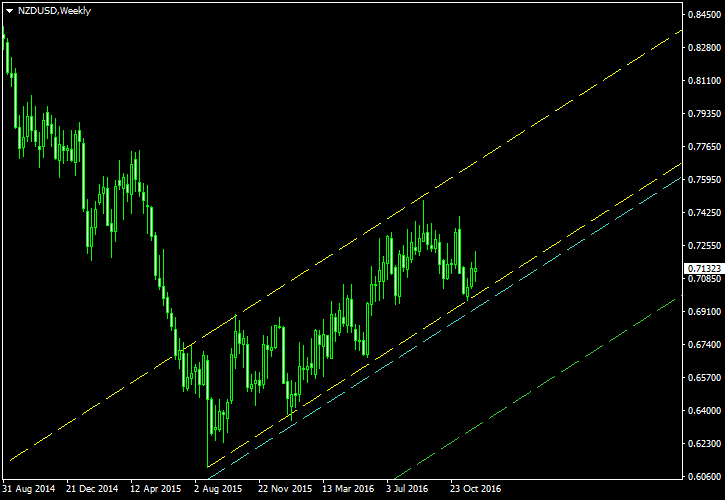
I detected this channel using the Channel Pattern Detector indicator and built this chart using the ChannelPattern script. You can download my MetaTrader 4 chart template for this NZD/USD pattern. You can trade it using my free Chart Pattern Helper EA.
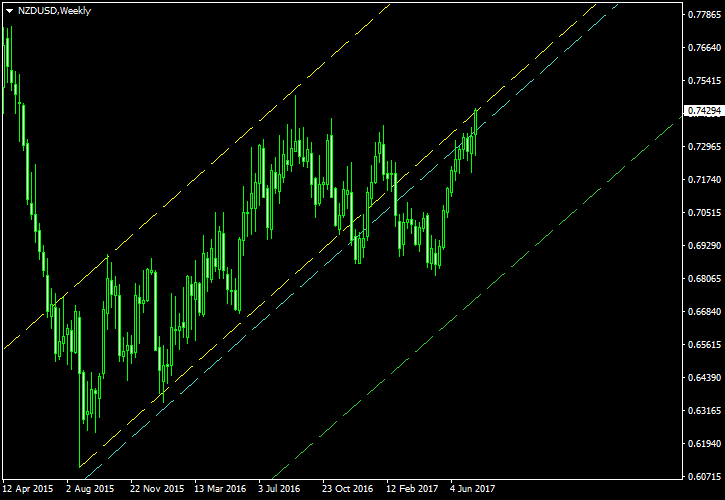
Update 2016-12-17: Yesterday at 15:43 GMT, the bearish breakout has triggered a short entry at 0.69414 with

Update 2017-07-21: The position has hit its
If you have any questions or comments regarding this ascending channel on NZD/USD chart, please feel free to submit them via the form below.