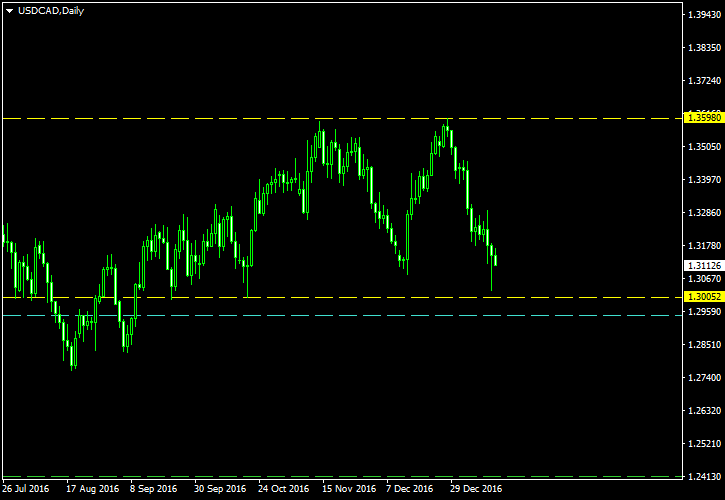
The Canadian dollar has formed another bearish pattern against its US counterpart — this time on the daily chart. The previous pattern (ascending channel) is still in play but does not look too good. The current pattern is not an ideal double top formation. Yet, the break below this double top’s neckline would constitute a valid entry signal and would definitely reinforce the earlier signal too.
The pattern is shown using the yellow lines on the image below. The upper horizontal line marks the two tops. The lower one marks the neckline. The cyan line is my entry level, which is placed at 10% buffer distance. The green line is going to be my

I have built this chart using the ChannelPattern script. You can download my MetaTrader 4 chart template for this USD/CAD pattern. You can trade it using my free Chart Pattern Helper EA.
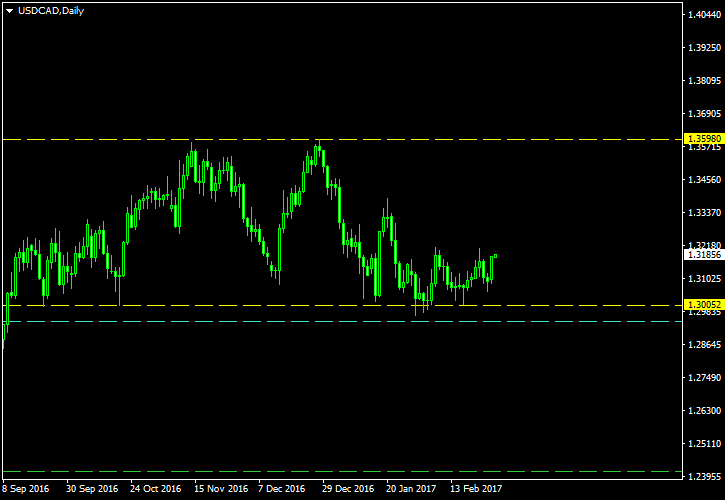
Update 2017-02-27: I am cancelling this trade because the chart no longer resembles a double top:
If you have any questions or comments regarding this double top on the USD/CAD chart, please feel free to submit them via the form below.