
In early 2008, when the global financial crisis started crippling the world economy, the New Zealand economy entered into recession. Correspondingly, for the most part of 2008, the Kiwi dollar remained on a declining note against the greenback. The New Zealand dollar is categorized as a commodity currency, along with its Australian and Canadian counterparts. While Australia is rich in raw materials, such as iron ore and coking coal, Canada owns the worldâs
Contents
- 1 Brief introduction to New Zealandâs dairy industry
- 2 Dairy prices and NZD exchange rate
- 3 Major importers of NZ dairy products
- 4 NZD’s rise as the king of carry trade
- 5 GDT vs. other New Zealand dollar currency pairs
- 6 GDT Price Index and Commitments of Traders
- 7 Conclusion
Brief introduction to New Zealandâs dairy industry
Until the 1980s, New Zealand farmers were mainly involved in raising sheep and beef cattle. As dairy farming turned more profitable when compared to other land uses, the farmers shifted to it. Farmers ship their products through dairy
In the early 1900s, there were as many as 500 dairy
In 2001, the NZDG and KCD merged together with the New Zealand Dairy Board to establish Fonterra, which now has a nearly complete control over the New Zealand dairy farming and export industry. Fonterra accounts for a quarter of the global dairy product volumes.
To ensure transparent price discovery mechanism, in 2008,
Dairy prices and NZD exchange rate
The chart below shows the correlation between the New Zealand dollar and the GDT Price Index from January 1999 through January 2017:
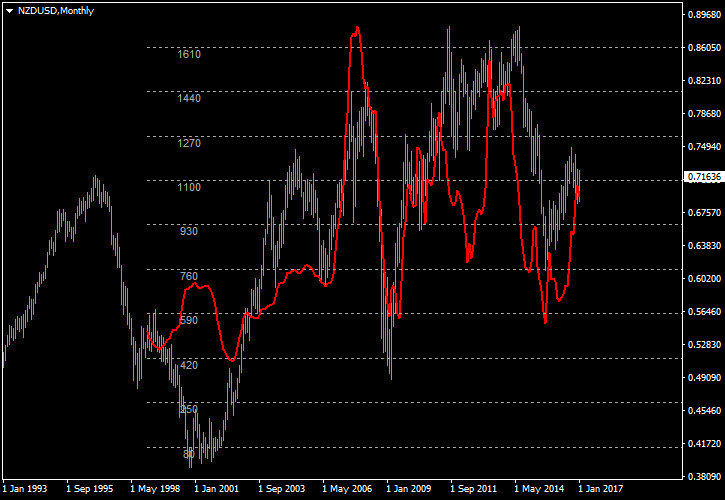
Based on the relationship between the dairy prices and the New Zealand dollar, the above chart can be virtually divided into three slices:
Now, to understand why the correlation between the price of dairy products (or GDT index as a whole) and the New Zealand dollar has changed over the past two decades, we should first of all have a clear idea of the demand profile of the dairy products. This will enable us to decipher the reason behind the rise or fall in the dairy prices and also its subsequent impact on the Kiwi. Furthermore, a clear understanding of the demand profile will enable a Forex trader to assess the future demand/supply situation and to forecast the currency’s trend with reasonable accuracy.
Major importers of NZ dairy products
The chart below illustrates the rise of China as the major consumer of dairy products in the past two decades. From a mere NZ$11.45 million worth dairy products imports in 2000, Chinese imports have risen to $2.5 billion in 2015. China’s dairy product imports from New Zealand peaked at NZ$4.6 billion in 2013.
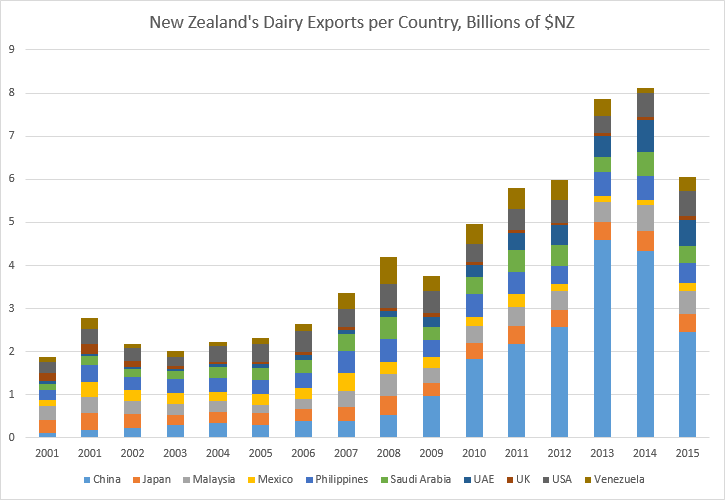
The opposite is true in the case of the United Kingdom. Being a part of the European Union, the UK continued to fulfill its demands by increasing its purchases from the countries in the mainland Europe. This explains why the UKâs share of imports from New Zealand has declined considerably over a period of time. Notably, the European Union would be the largest exporter of dairy products if it were a single country.
Between 1999 and 2003, the main export product of New Zealand was sheep and cattle meat. Thus, the price of dairy products had little influence over the exchange rate of the New Zealand dollar. The negative correlation during that period is clearly explained by the fact that the GDT Price Index is denominated in USD. With a lack of direct influence of the dairy prices on the New Zealand’s currency, the lower NZD/USD rate would result in a similarly higher GDT index and
However, the steady increase in demand for dairy products from China, United Arab Emirates, and Saudi Arabia made New Zealand a powerhouse of dairy product exports. The signing of free trade agreement with China bolstered the price and volume of dairy products shipped out of New Zealand. Imports into China began to influence the price of dairy products after 2003. This was a period when China was recording
NZD’s rise as the king of carry trade
In the aftermath of the financial crisis in 2008, central banks across the world slashed interest rates to flush the market with money and spur growth. By 2013, New Zealand was one of the few developed countries with AAA credit rating to offer high interest rate — 2.5% at that time. The interest rate was 0.25% in the USA and the eurozone that year. The higher interest rates attracted the investors and speculators who were looking for a
A decline in the price of dairy products was unable to push the New Zealand dollar downwards because of the demand from investors and speculators who used every dip to buy the currency. This was probably one of the prime reasons for the lag that developed between the GDT index movement and the New Zealand dollar.
The booming housing market and large inflow of tourists also kept the New Zealand dollar strong enough to resist the impact of dairy product prices.
GDT vs. other New Zealand dollar currency pairs
Until now, we studied the correlation between the GDT Price Index and the NZD/USD pair. How about other NZD based pairs? To assess whether the correlation between the GDT index and the New Zealand dollar is influenced by the second currency in a NZD based pair, let us study the most commonly traded ones.
AUD/NZD
The chart below illustrates the relationship of AUD/NZD pair with GDT Price Index:
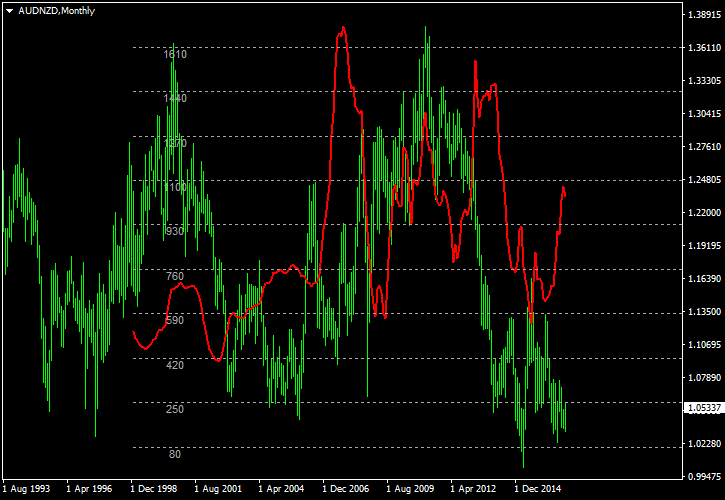 Between 1999 and April 2004, the AUD/NZD pair moved in tandem with the GDT index. The situation changed in the second half of 2004 when the AUD/NZD pair began exhibiting a negative correlation. This was also the period when New Zealandâs dairy exports to China increased at a formidable pace. The 2008 financial crisis eroded the value of the New Zealand dollar. Thus, a rise in the volumes and price of the dairy products did not have considerable influence on the New Zealand dollar. So, the AUD/NZD pair and GDT index once again began moving in tandem. In May 2012, the Reserve Bank of Australia slashed interest rates by 50 basis points to 3.75%. Analysts were expecting only a 25 basis points cut. The overwhelmingly negative news weakened the Aussie against its rivals. Thus, from May 2012 onward, the AUD/NZD pair began exhibiting negative correlation with the GDT index. The rise of the New Zealand dollar as a favorite carry trade currency among investors also aided the negative correlation.
Now, let’s look at three other popular pairs (NZD/CAD, NZD/JPY, and NZD/CHF) to assess whether any other currency has any effect on the overall correlation.
In the pairs taken for study, the Canadian dollar is a commodity currency, whereas the yen and franc are regarded as safe haven currencies. The safe haven currencies and commodity currencies usually exhibit a lot of volatility during periods of global uncertainty. This was the main reason for selecting these popular high volume pairs for the study.
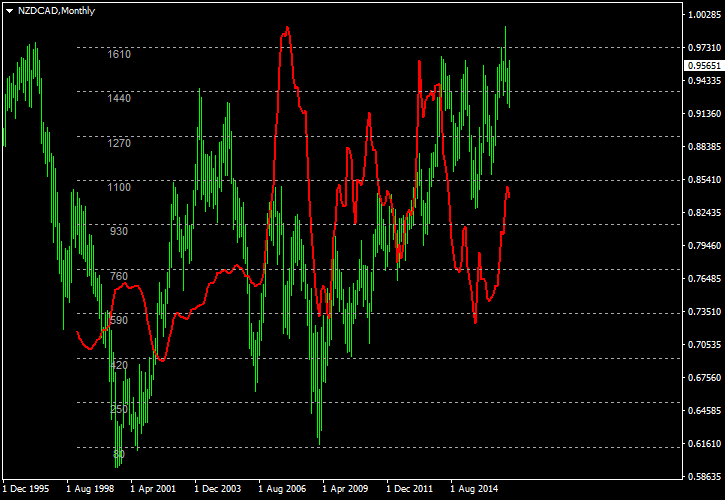
The correlation of both NZD/CAD and NZD/JPY pairs with the GDT Price Index is similar to the correlation between the NZD/USD pair and the GDT Price Index.
NZD/CAD
NZD/JPY

NZD/CHF
However, as shown below, the correlation between the NZD/CHF pair and the GDT Price Index is quite different from the others in the period ranging from June 2010 to 2015.
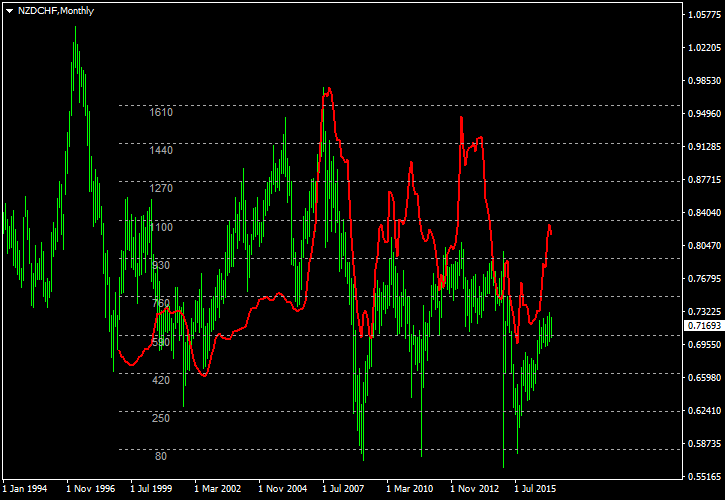
The NZD/CHF pair began exhibiting negative correlation with the GDT index starting from June 2010. The Swiss National Bank (SNB) officially began intervening in the market in March 2009. However, the SNB abandoned the intervention strategy in June 2010, after the maneuver failed to yield the necessary results. This strengthened the Swiss Franc against all the currencies including the New Zealand dollar, in spite of a rise in the dairy prices. The SNB once again started intervention in the market in the second half of 2011, after losing nearly CHF10 billion earlier that year. The established exchange rate limit helped the NZD/CHF pair to move in line with the rise and fall of the GDT index between December 2012 and February 2013. However, the demand for the Swiss franc became so high that even intervention and negative interest rates did not work as intended. Thus, a rise in the dairy prices during that period did not have any positive effect on the New Zealand currency. The correlation restored after SNB had removed its EUR/CHF cap policy in January 2015.
NZ interest rates vs. NZD/CHF
It would be interesting to see how much of an impact does the benchmark interest rate have on the Kiwi dollar. Let us take the NZD/JPY pair for study purposes. The orange line in the chart below is the interest rate changes, while the red line is the GDT index.
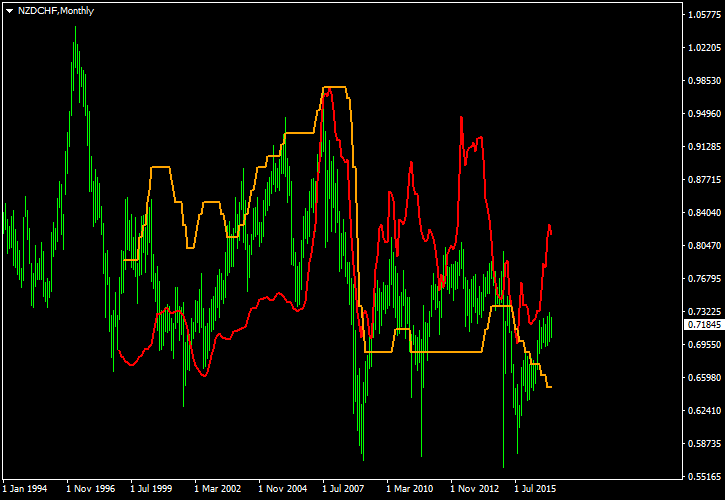
The following can be inferred from the above chart:
To put it otherwise,
GDT Price Index and Commitments of Traders
Now, let us examine how market participants respond to changes in the GDT Price Index in the derivatives market. For this purpose, you can look at the chart below with the Commitment of Traders report (CoT) difference of
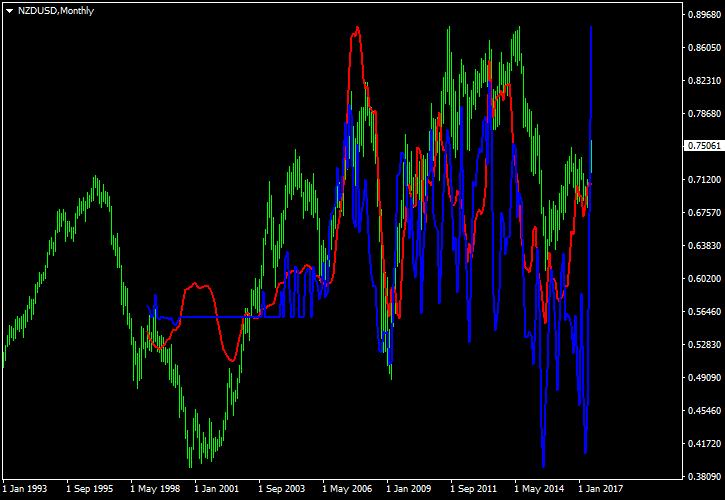
Update 2017-07-28: The chart above was updated to actually show NZD/USD rates — it was a NZD/CHF chart before the update.
The chart indicates that smart money moves well ahead of the GDT index in anticipation of a rise or fall in the dairy prices. This is mainly because major funds are equipped with
Conclusion
The exchange rate of the New Zealand dollar is affected by both interest rate decisions and changes in the GDT Price Index reading. During the last few years, the
If you have some interesting notes or questions about the New Zealand dollar and its relationship with the global dairy market, you can post them using the commentary form below.