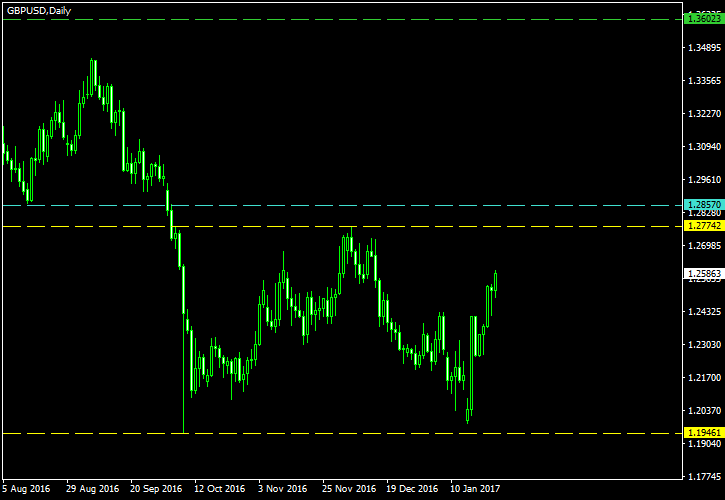
The double bottom that is currently forming on the daily GBP/USD chart has a potential for stopping the
The image below shows the double bottom marked with the yellow lines. The lower one marks the two troughs. The upper one marks the neckline and midpoint. The cyan line will be used as an entry level for a bullish breakout. I will set my

I have built this chart using the ChannelPattern script. You can download my MetaTrader 4 chart template for this GBP/USD pattern. You can trade it using my free Chart Pattern Helper EA.
Update 2017-02-18: I have cancelled the pending order as the chart no longer resembles a proper double bottom pattern.

If you have any questions or comments regarding this double bottom on GBP/USD chart, please feel free to submit them via the form below.