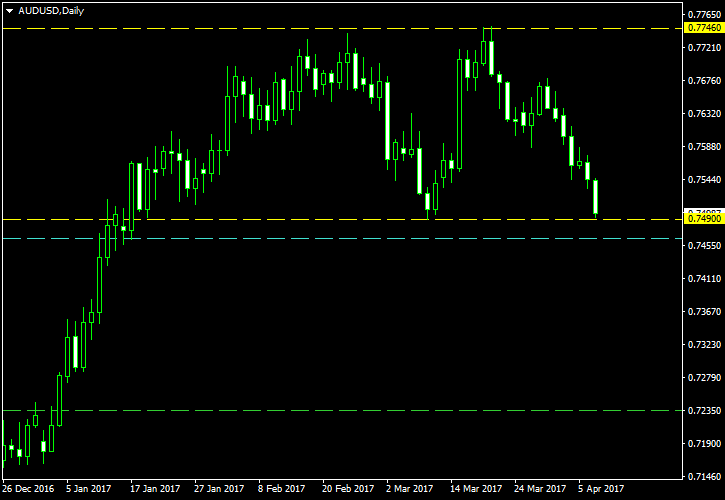
This double top formation is a quite big one considering that the preceding uptrend did not last too long and did not gain many pips for the Aussie. Nevertheless, it satisfies the main requirements of a valid double top pattern and can be used for a bearish breakout setup.
The pattern tops are marked with the upper horizontal yellow line. The lower horizontal yellow line marks the neckline of the double top. The cyan line is the entry level positioned at 10% of the pattern’s height below the neckline. The green line is the target level positioned at 100% of the same distance. I will set my

I have built this chart using the ChannelPattern script. You can download my MetaTrader 4 chart template for this AUD/USD pattern. You can trade it using my free Chart Pattern Helper EA.
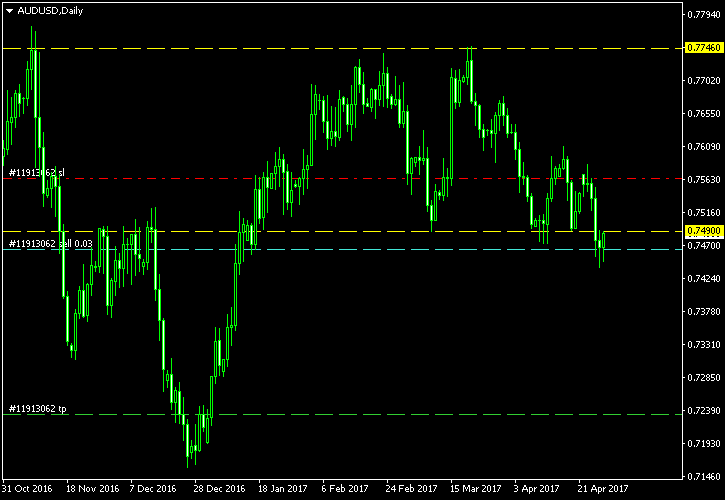
Update 2017-04-29: Sell trade entered at 13:33 GMT on April 26. The entry point is at 0.74644 with SL at 0.75644 and TP at 0.72341. The breakout does not look to be strong:
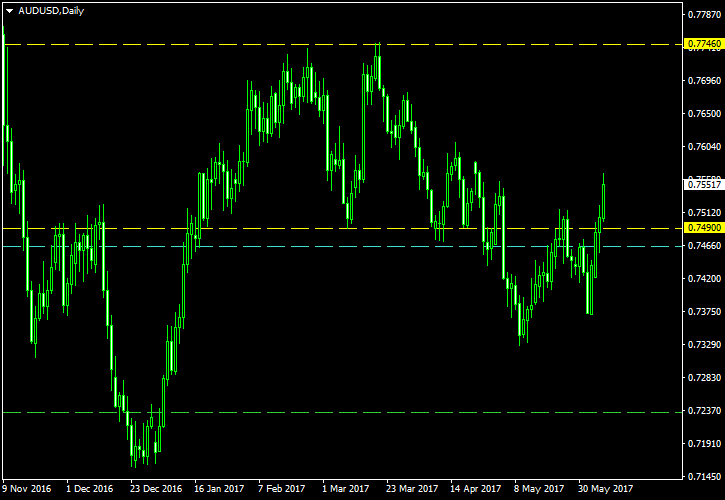
Update 2017-06-07: The price has hit my
If you have any questions or comments regarding this double top on the AUD/USD chart, please feel free to submit them via the form below.