
A rather rough bullish pennant pattern has formed on the 4-hour chart of the USD/JPY currency pair. The pair’s rally started on June 14 following a new monthly low. It has managed to set up a new higher high and then entered a consolidation that seems like a valid bullish pennant formation, which suggests a continuation of an upward trend after an upside breakout.
The pennant is shown with the yellow lines on the chart screenshot below. The cyan line is my entry line positioned at 10% of the pattern’s height above the upper border. The green line will serve as my
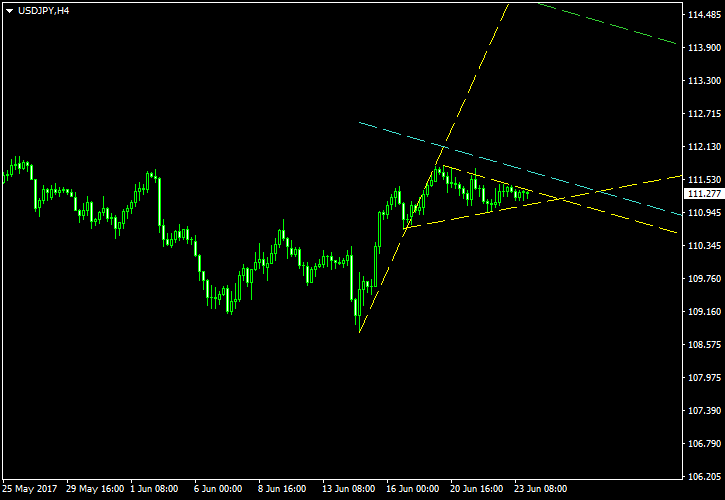
You can download my MetaTrader 4 chart template for this USD/JPY pattern. It can be traded using my free Chart Pattern Helper EA.
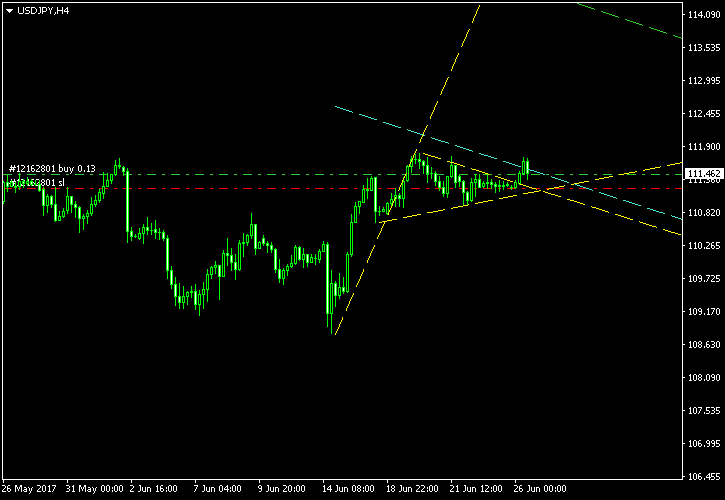
Update 2017-06-26 13:58 GMT: 7 hours ago, USD/JPY has broken out of the pennant, entering a long position at 111.445 with a
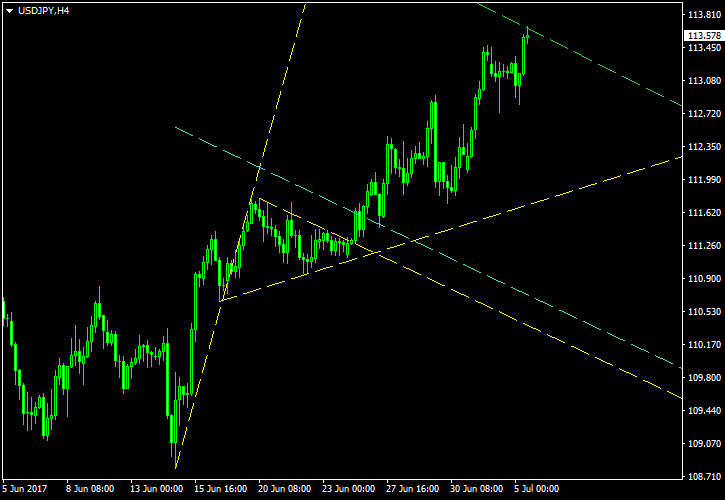
Update 2017-07-05 11:18 GMT: Just a few minutes ago, the pair rallied to my
If you have any questions or comments regarding this bullish pennant on USD/JPY chart, please feel free to submit them via the form below.