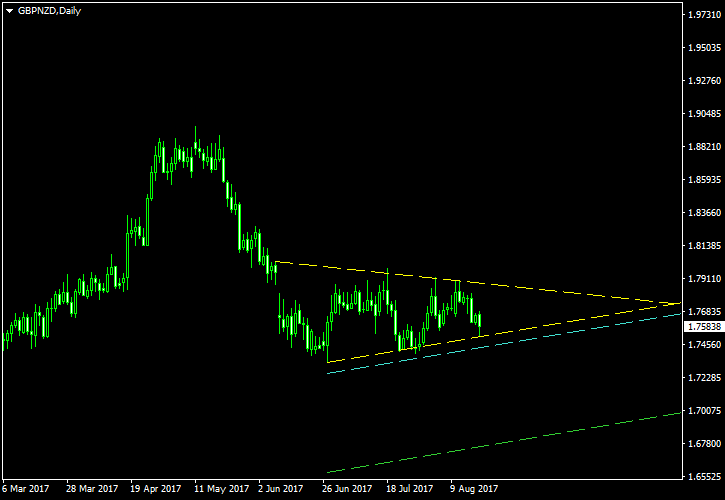
The pound had experienced a rather strong rally against the New Zealand dollar from the beginning of 2017 through the middle of May. It then entered a similarly rapid downtrend, which stalled near the end of June. Since then, the currency pair entered a consolidation phase, which has now took a form of a symmetrical triangle pattern.
That triangle is marked with the yellow lines on the chart screenshot below. The cyan line is my potential breakout entry level. It was placed at 10% of the triangle’s base height below the lower border. The green line is my potential

I have built this chart using the ChannelPattern script. You can download my MetaTrader 4 chart template for this GBP/NZD pattern. You can trade it using my free Chart Pattern Helper EA.
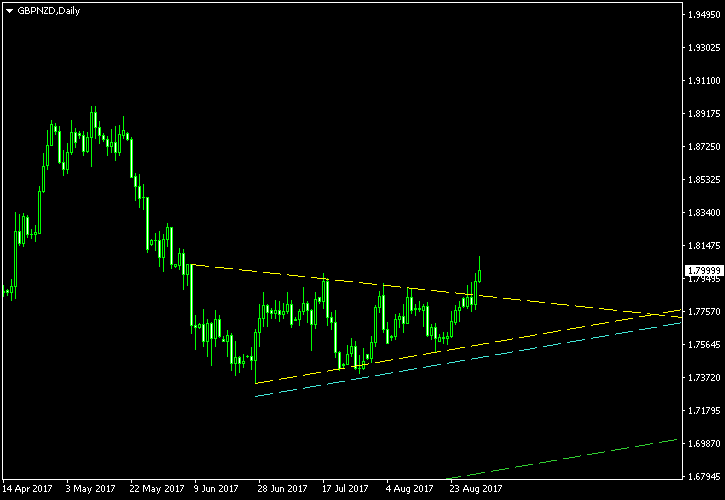
Update 2017-08-31: I have cancelled the whole setup because the pattern had broken out to the upside:
If you have any questions or comments regarding this symmetrical triangle on the GBP/NZD chart, please feel free to submit them via the form below.