Mix of Symmetrical and Ascending Triangle on Daily Chart of GBP/NZD

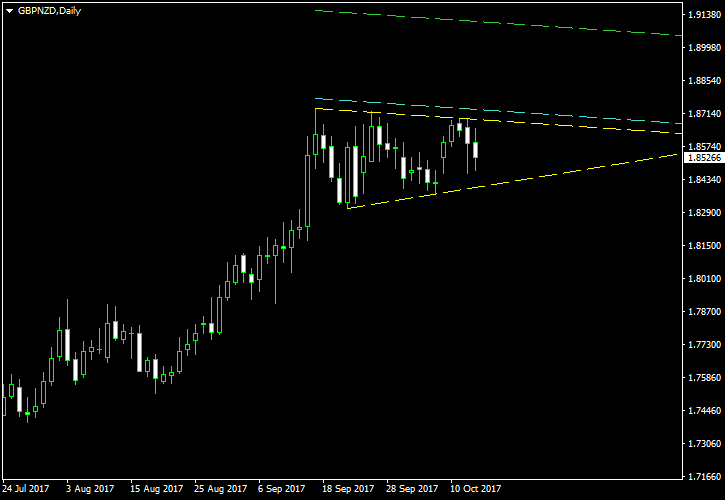
After this August’s failed symmetrical triangle pattern, GBP/NZD is consolidating in a fusion of ascending and symmetrical triangles. However, now it points towards an uptrend continuation following a bullish breakout from the previous symmetrical triangle.
On the image below, the pattern itself is marked using the yellow lines. The cyan line is my entry level located at 10% of the triangle’s height above the upper border. The green line will serve as my take-profit level and is based on 100% of the same distance. The stop-loss will be set to the low of the breakout candle or to the low of the previous candle if the body of the breakout one is positioned mostly outside the triangle. I will ignore bearish breakouts from this formation as it is a continuation pattern following a rising trend. You can click on the image to see a full-size screenshot:

I have built this chart using the ChannelPattern script. You can download my MetaTrader 4 chart template for this GBP/NZD pattern. You can trade it using my free Chart Pattern Helper EA.
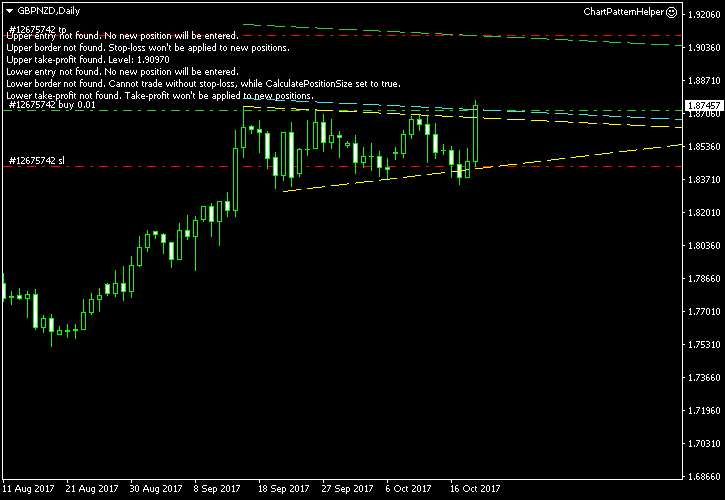
Update 2017-10-19 7:14 GMT: The long entry level was hit less than 4 hours ago at 1.87214 with stop-loss at 1.84369 and take-profit at 1.90970. The risk-to-reward ratio does not look great here, but the breakout seems strong:

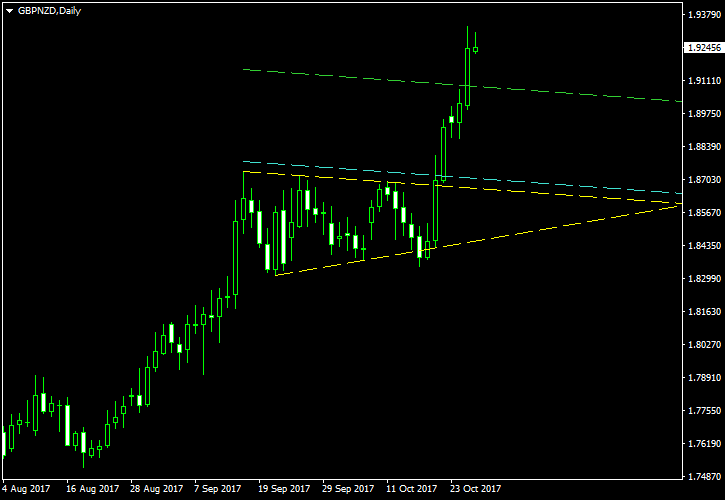
Update 2017-10-26: The take-profit was reached yesterday at 8:30 GMT. The exit price was 1.90871, which is lower than the original target due to the sloping take-profit line. The trade went very fast thanks to the New Zealand government plans regarding the country’s central bank.

If you have any questions or comments regarding this symmetrical triangle on the GBP/NZD chart, please feel free to submit them via the form below.

Leave a Reply

Your email address will not be published. Required fields are marked *

one + seven =