
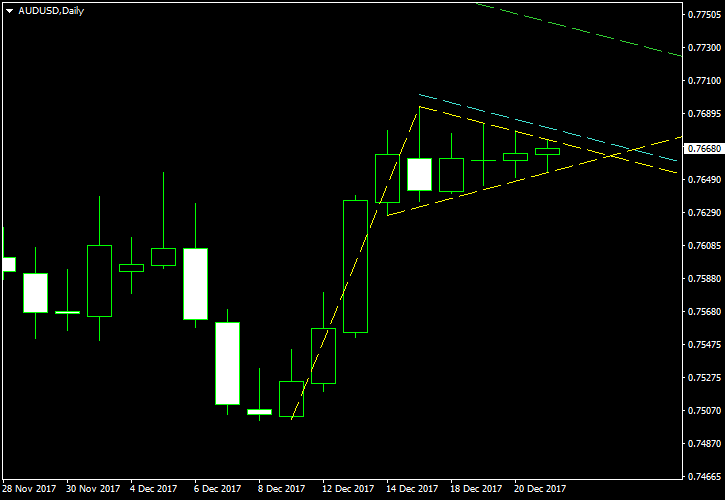
AUD/USD is currently consolidating inside a perfect example of a bullish pennant pattern. The daily chart shows that after four days of rally, the currency pair stalled and is now trading in a narrowing range for five days in a row.
The pennant itself is marked with the yellow lines on the image below. The cyan line is my entry level in case of a bullish breakout. It is placed at 10% of the pennant’s width above the upper border. The green line is my potential
You can download my MetaTrader 4 chart template for this AUD/USD pattern. It can be traded using my free Chart Pattern Helper EA.
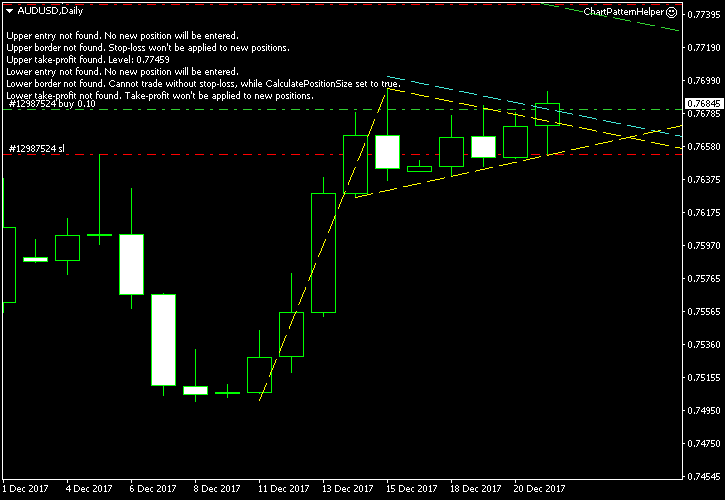
Update 2017-12-21 14:06 GMT: It did not take long for the Aussie to break out of the pennant. It triggered my buy stop order just half an hour ago at 0.76808 with a
Update 2017-12-27 10:47 GMT: My

If you have any questions or comments regarding this bullish pennant on AUD/USD chart, please feel free to submit them via the form below.