
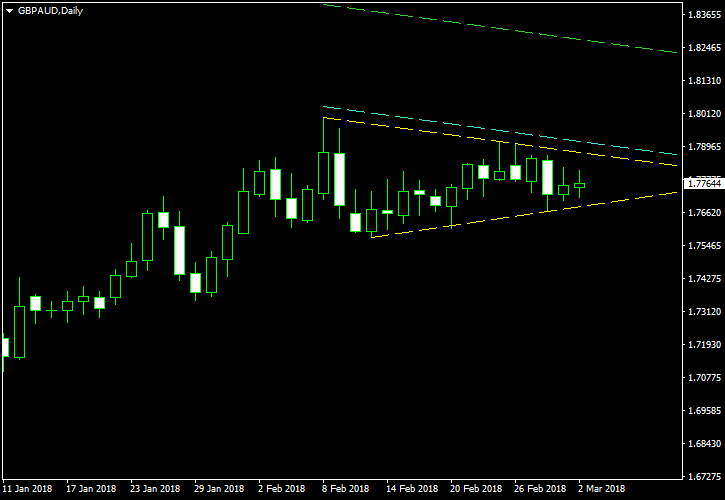
A rather short-lived uptrend on the GBP/AUD daily chart that lasted from January 11 through February 8 has ended in a consolidation pattern known as a symmetrical triangle. The triangle is a continuation formation, which would prompt us to buy the currency pair should the bullish breakout occur.
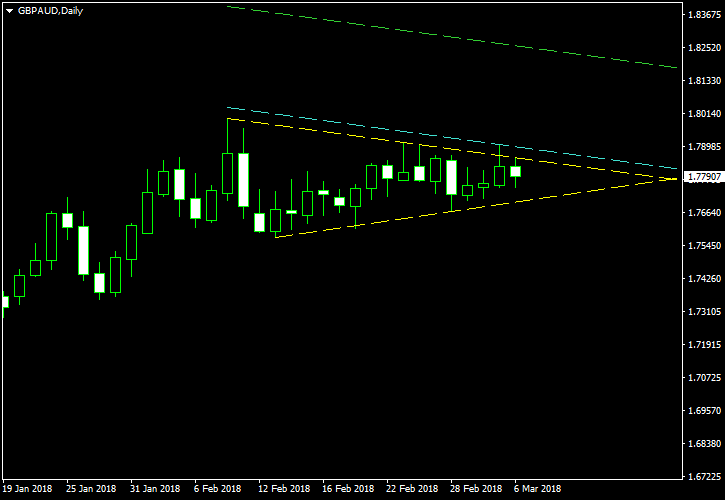
The image below shows the triangle’s sides marked with the yellow lines. My potential entry level is marked with the cyan line — it is positioned at 10% of the triangle’s base width above the upper border. The take-profit level is marked with the green line and is located at 100% of the same distance. As it is always the case with the bullish setups, I recommend setting your stop-loss to the low of the breakout candle. Should the breakout candle’s body appear mostly above the upper border, the low of the preceding candle can be used for a stop-loss. I use symmetrical triangles only as a trend continuation pattern and will not trade a reversal breakout here. You can click on the chart to see its larger version:
I have built this chart using the ChannelPattern script. You can download my MetaTrader 4 chart template for this GBP/AUD pattern. You can trade it using my free Chart Pattern Helper EA.
Update 2018-03-06: The pair has touched my entry line during a short-lived spike yesterday at 15:37 GMT. The entry rate was 1.79067 with stop-loss at 1.77647 and take-profit at 1.82612. Unfortunately, the breakout looks completely fake.
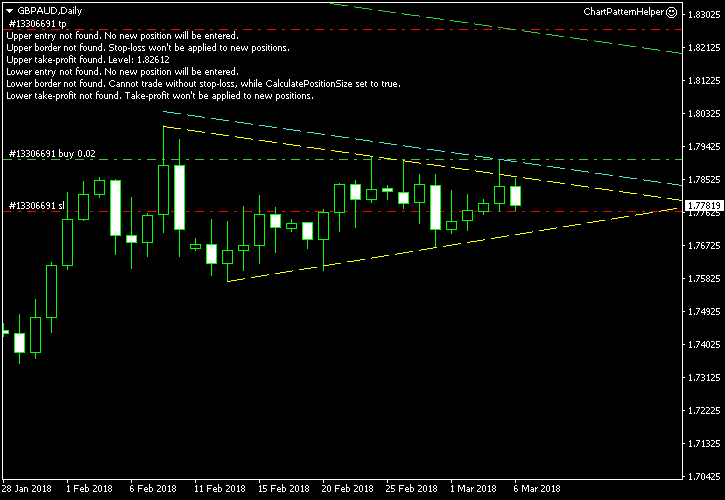
Update 2018-03-06 14:55 GMT: Stop-loss has been hit two hours ago.
If you have any questions or comments regarding this symmetrical triangle on the GBP/AUD chart, please feel free to submit them via the form below.