NZD/USD Could Tank Following Double Top Formation

Having bounced twice from the horizontal resistance level near 0.7436, the New Zealand dollar has seemingly stopped its advance against the US counterpart. The uptrend, which lasted from mid-November last year through late January this year, is now crowned with a double top pattern. A downside breakout through the pattern’s middle point would trigger a sell opportunity.
The yellow lines mark the tops and the “neckline” of the pattern. The cyan line is my potential entry level. It is placed at 10% of the pattern’s height below the “neckline.” The take-profit level is marked with the green line, which is positioned at 100% of the height below the lower yellow line. I will set my stop-loss to the high of the breakout candle or to the high of the preceding one if the breakout candle appears to be mostly outside the formation. I will ignore bullish breakouts from this double top. You can click on the image below to see a full-size screenshot:

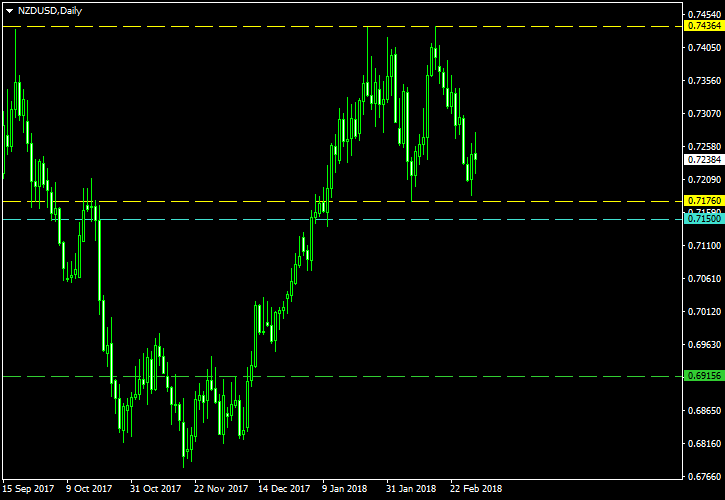
I have built this chart using the ChannelPattern script. You can download my MetaTrader 4 chart template for this NZD/USD pattern. You can trade it using my free Chart Pattern Helper EA.
If you have any questions or comments regarding this double top on the NZD/USD chart, please feel free to submit them via the form below.

Leave a Reply

Your email address will not be published. Required fields are marked *

eight + 1 =